# openstatus — full content
> Openstatus is an open-source uptime monitoring and status page platform. It runs synthetic checks in parallel from 28 regions across Fly.io, Koyeb, and Railway, surfaces incidents on branded status pages, and exposes a REST API plus MCP server for programmatic control. Available as managed SaaS or self-hosted (AGPL-3.0). Bootstrapped, founded in 2023. Blog posts, changelog entries, guides, use cases, and comparisons live in [llms.txt](https://www.openstatus.dev/llms.txt) as links — not inlined here.
## Who it's for
- Development teams that want transparent incident communication
- Companies that need multi-region uptime monitoring
- Teams that prefer infrastructure-as-code workflows (monitoring as code via YAML)
- Organizations that require self-hosted monitoring behind a firewall (private locations)
- Open-source projects and startups looking for a free or affordable monitoring solution
## Pricing
- **Hobby** — $0/month: 1 monitor, 6 regions, 10m check interval, 1 status page, 3 page components, 14-day data retention
- **Starter** — $30/month: 20 monitors, 28 regions, 1m check interval, 1 status page, 20 components, 3-month retention, subscribers, custom domain, WhatsApp/SMS/PagerDuty alerts
- **Pro** — $100/month: 50 monitors, 28 regions, 30s check interval, 5 status pages, 50 components, 12-month retention, private locations, OTel exporter, 20 notification channels
- **Scale** — $500/month: everything in Pro plus 10 status pages, 500 page components, and White Label, Magic Link auth, and IP Restriction included at no extra cost
Annual billing gives 2 months free (Starter $300/yr, Pro $1,000/yr, Scale $5,000/yr). Pricing is available in USD and EUR.
## Key Features
- **28-region monitoring** — Parallel checks across Europe, North America, South America, Asia, Africa, and Oceania; no round-robin, all selected regions fire simultaneously
- **Multi-cloud** — Monitors run on Fly.io, Koyeb, and Railway for true cloud diversity
- **Status Pages** — Branded public or password-protected pages with custom domains, themes, maintenance windows, and subscriber notifications (email, RSS, Slack)
- **API Monitoring** — Assertions, thresholds, status code checks, header and body validation
- **Monitoring as Code** — Define monitors in YAML, manage via CLI or GitHub Actions
- **Private Locations** — 8.5MB Docker image for monitoring internal services behind firewalls
- **Alerting** — Email, Slack, Discord, webhook, WhatsApp, SMS, PagerDuty, OpsGenie, Grafana OnCall
- **OpenTelemetry** — Export synthetic check metrics to any OTLP endpoint
- **SDK** — Node.js SDK on JSR (@openstatus/sdk-node)
- **MCP server** — Streamable-HTTP MCP at https://api.openstatus.dev/mcp for status reports, maintenance windows, and monitor reads
- **Open-source** — AGPL-3.0-licensed, self-hostable, 8k+ GitHub stars
## Key Differentiators
- Open-source and bootstrapped (no VC funding)
- Parallel scheduling — all selected regions check simultaneously (vs. round-robin competitors)
- Unlimited team members on paid plans
- Status page subscribers included (not a paid add-on)
- Private status pages included in the team plan (not an additional charge)
- Self-hosting option with full feature parity
---
---
title: "Open Source Status Page & Uptime Monitoring"
date: Apr 07, 2026
author: "openstatus"
description: "The status page trusted by growing teams. Communicate incidents, prove compliance readiness, and stay audit-ready on your own domain. Hosted for you, or self-host the open source stack."
category: "product"
---
[Free to start. Paid plans from $30/mo. Open source and self-hostable.
## Trusted by teams who ship transparency
## The status page that closes enterprise deals
Security questionnaires ask how you notify customers during an incident. openstatus answers that in one link: a branded page on your own domain, with timestamped incident history an auditor can read without asking you for screenshots.
Themes, custom domains, public or password-protected access, status reports, maintenance windows and subscriptions: see it all on [status pages](/status-page).
## Monitor from 28 regions: know before your customers do
Monitor your endpoints from 28 regions across multiple clouds. Get alerted on Slack, Discord, PagerDuty, or email the moment something breaks. Your status page updates automatically, with no manual work during incidents.
Read more about [uptime monitoring](/uptime-monitoring).
## Managing openstatus for humans and agents
Every action in the dashboard is reachable programmatically. One API key, four ways in:
- **[CLI](/tooling/cli)**: manage from your terminal
- **[API](/tooling/api)**: typed HTTP endpoints with an [OpenAPI spec](https://api.openstatus.dev/openapi)
- **[MCP server](/tooling/mcp-server)**: let Claude, ChatGPT, or Cursor run your monitoring
- **[Terraform provider](/tooling/terraform)**: version monitors as HCL
Read more about our [tooling](/tooling).
## Try it before you sign up
Check any URL's response time from every one of our 28 regions. No account, no credit card. It's the same probe network that powers your monitors.
Global Speed Checker](https://app.openstatus.dev)
---
**Status Page**
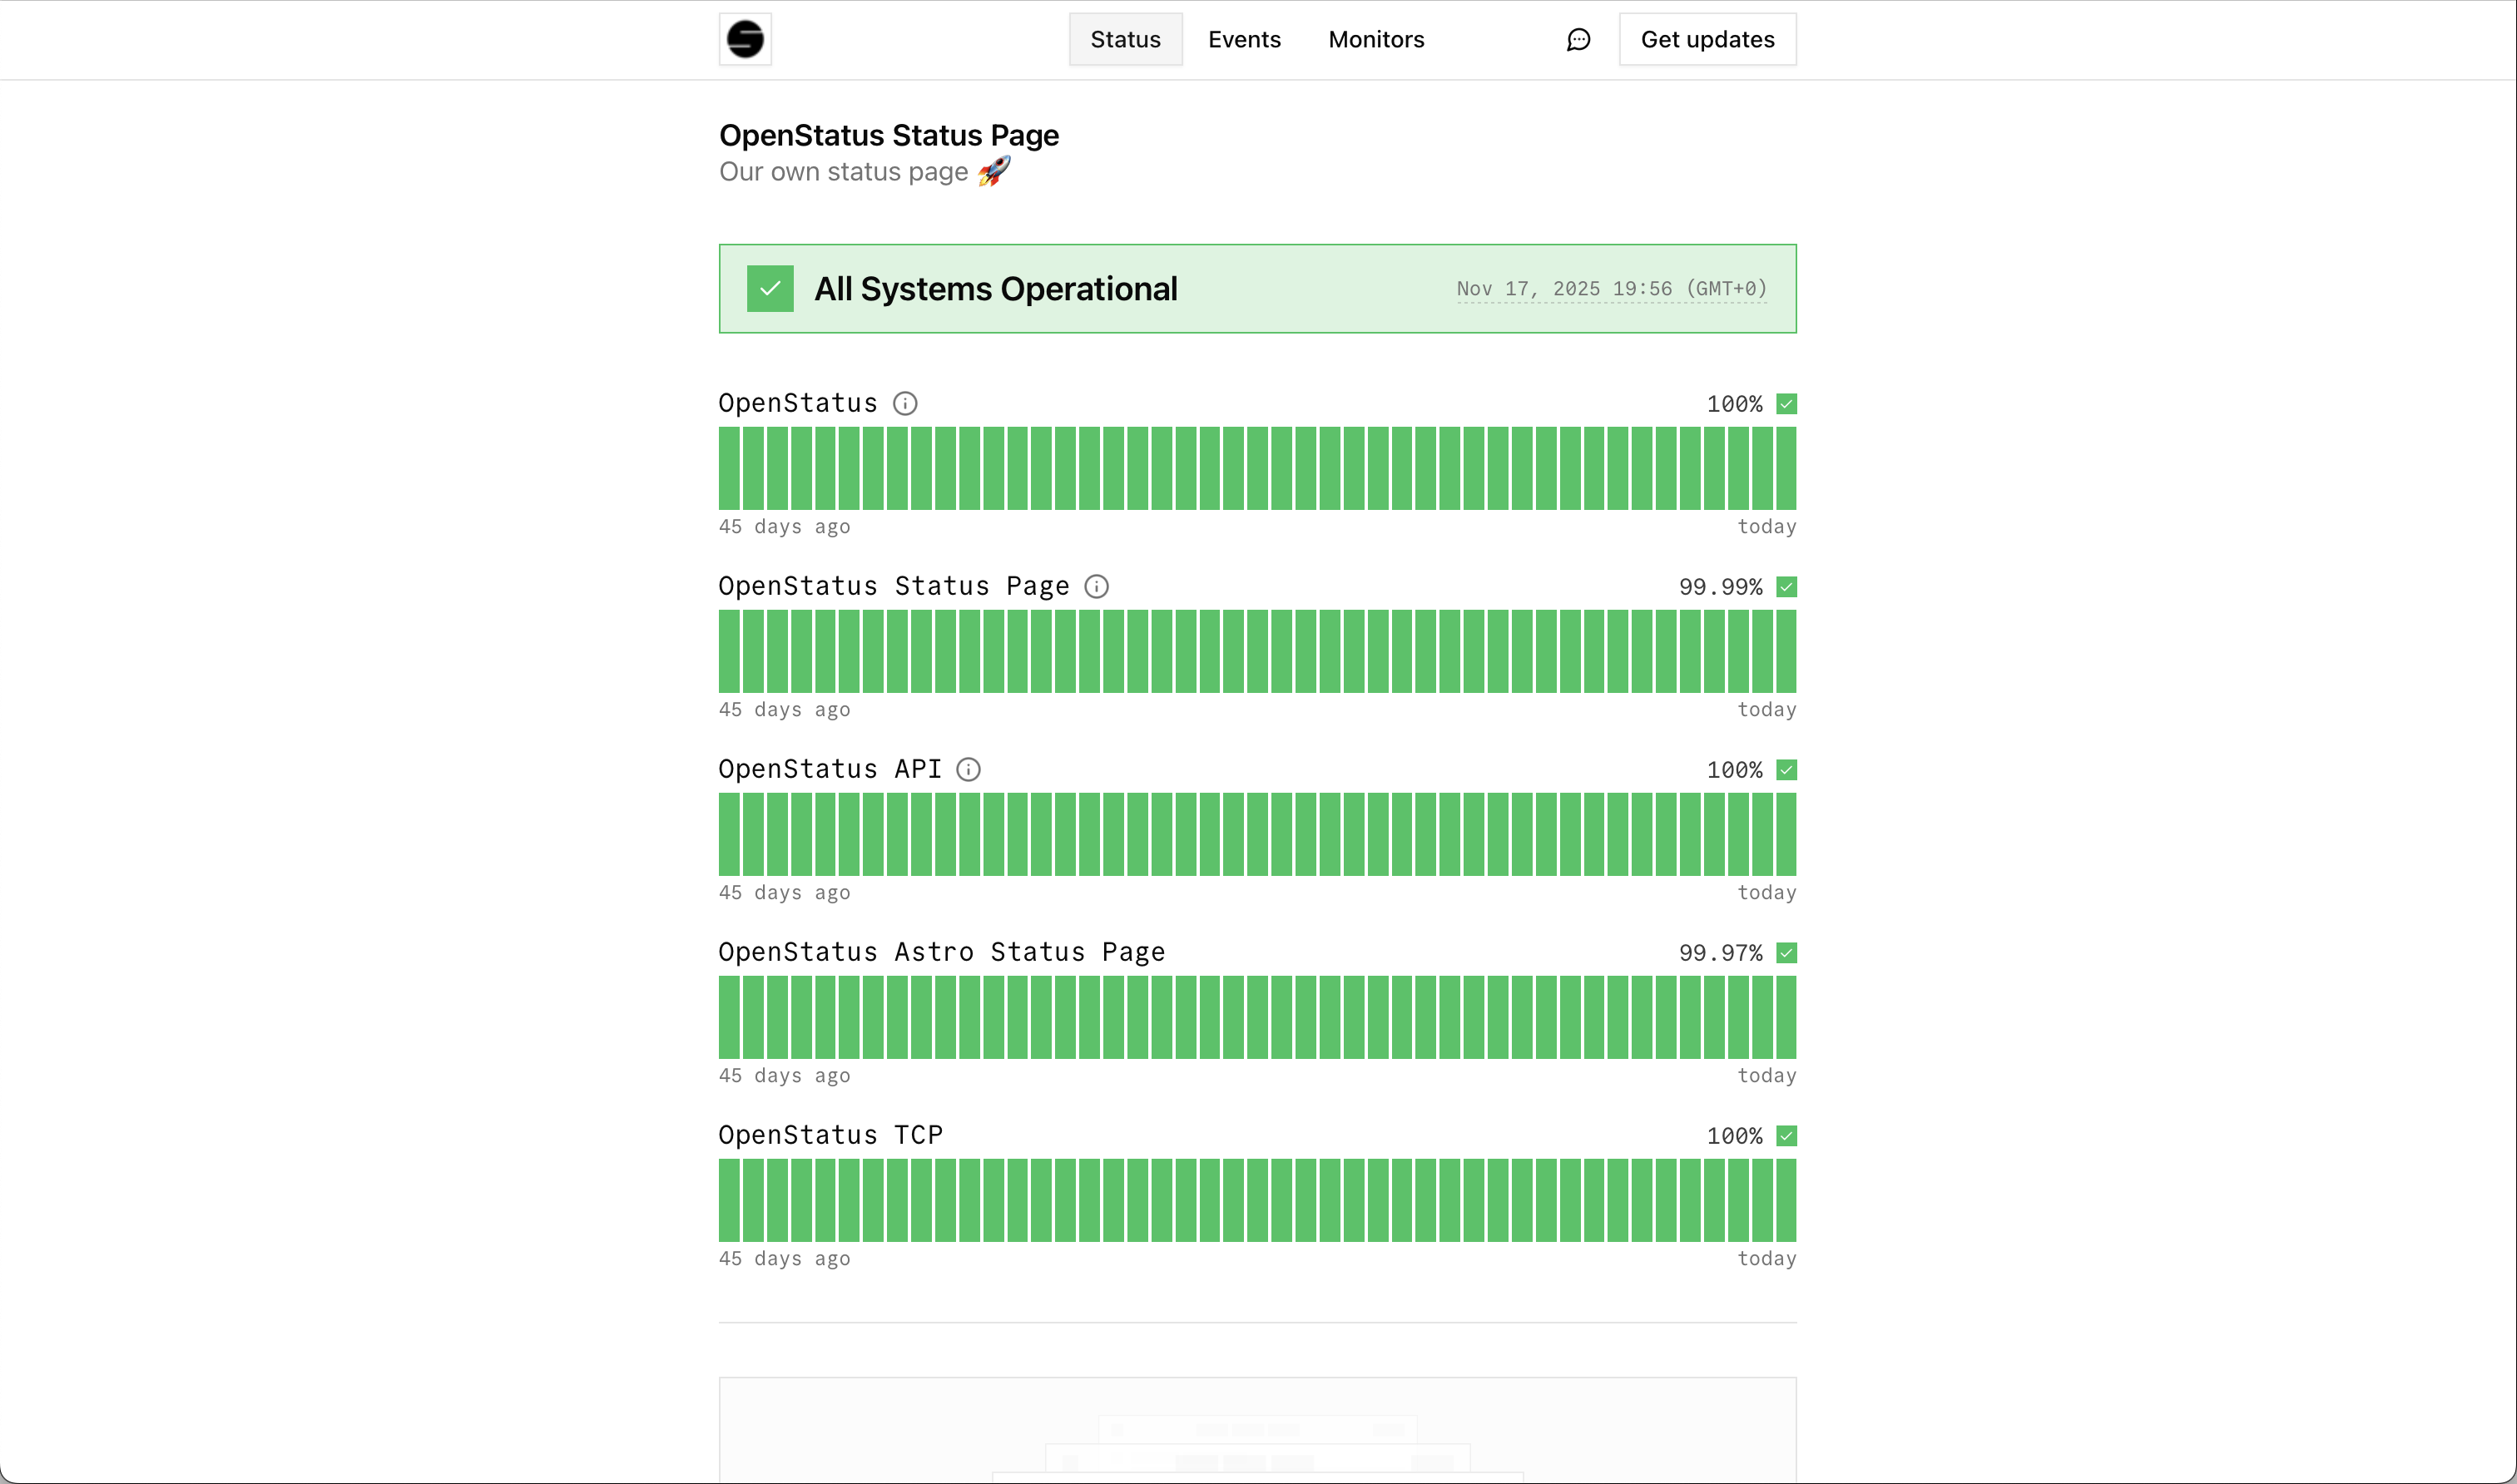
[Visit our Theme Explorer](https://themes.openstatus.dev)
**Dashboard**
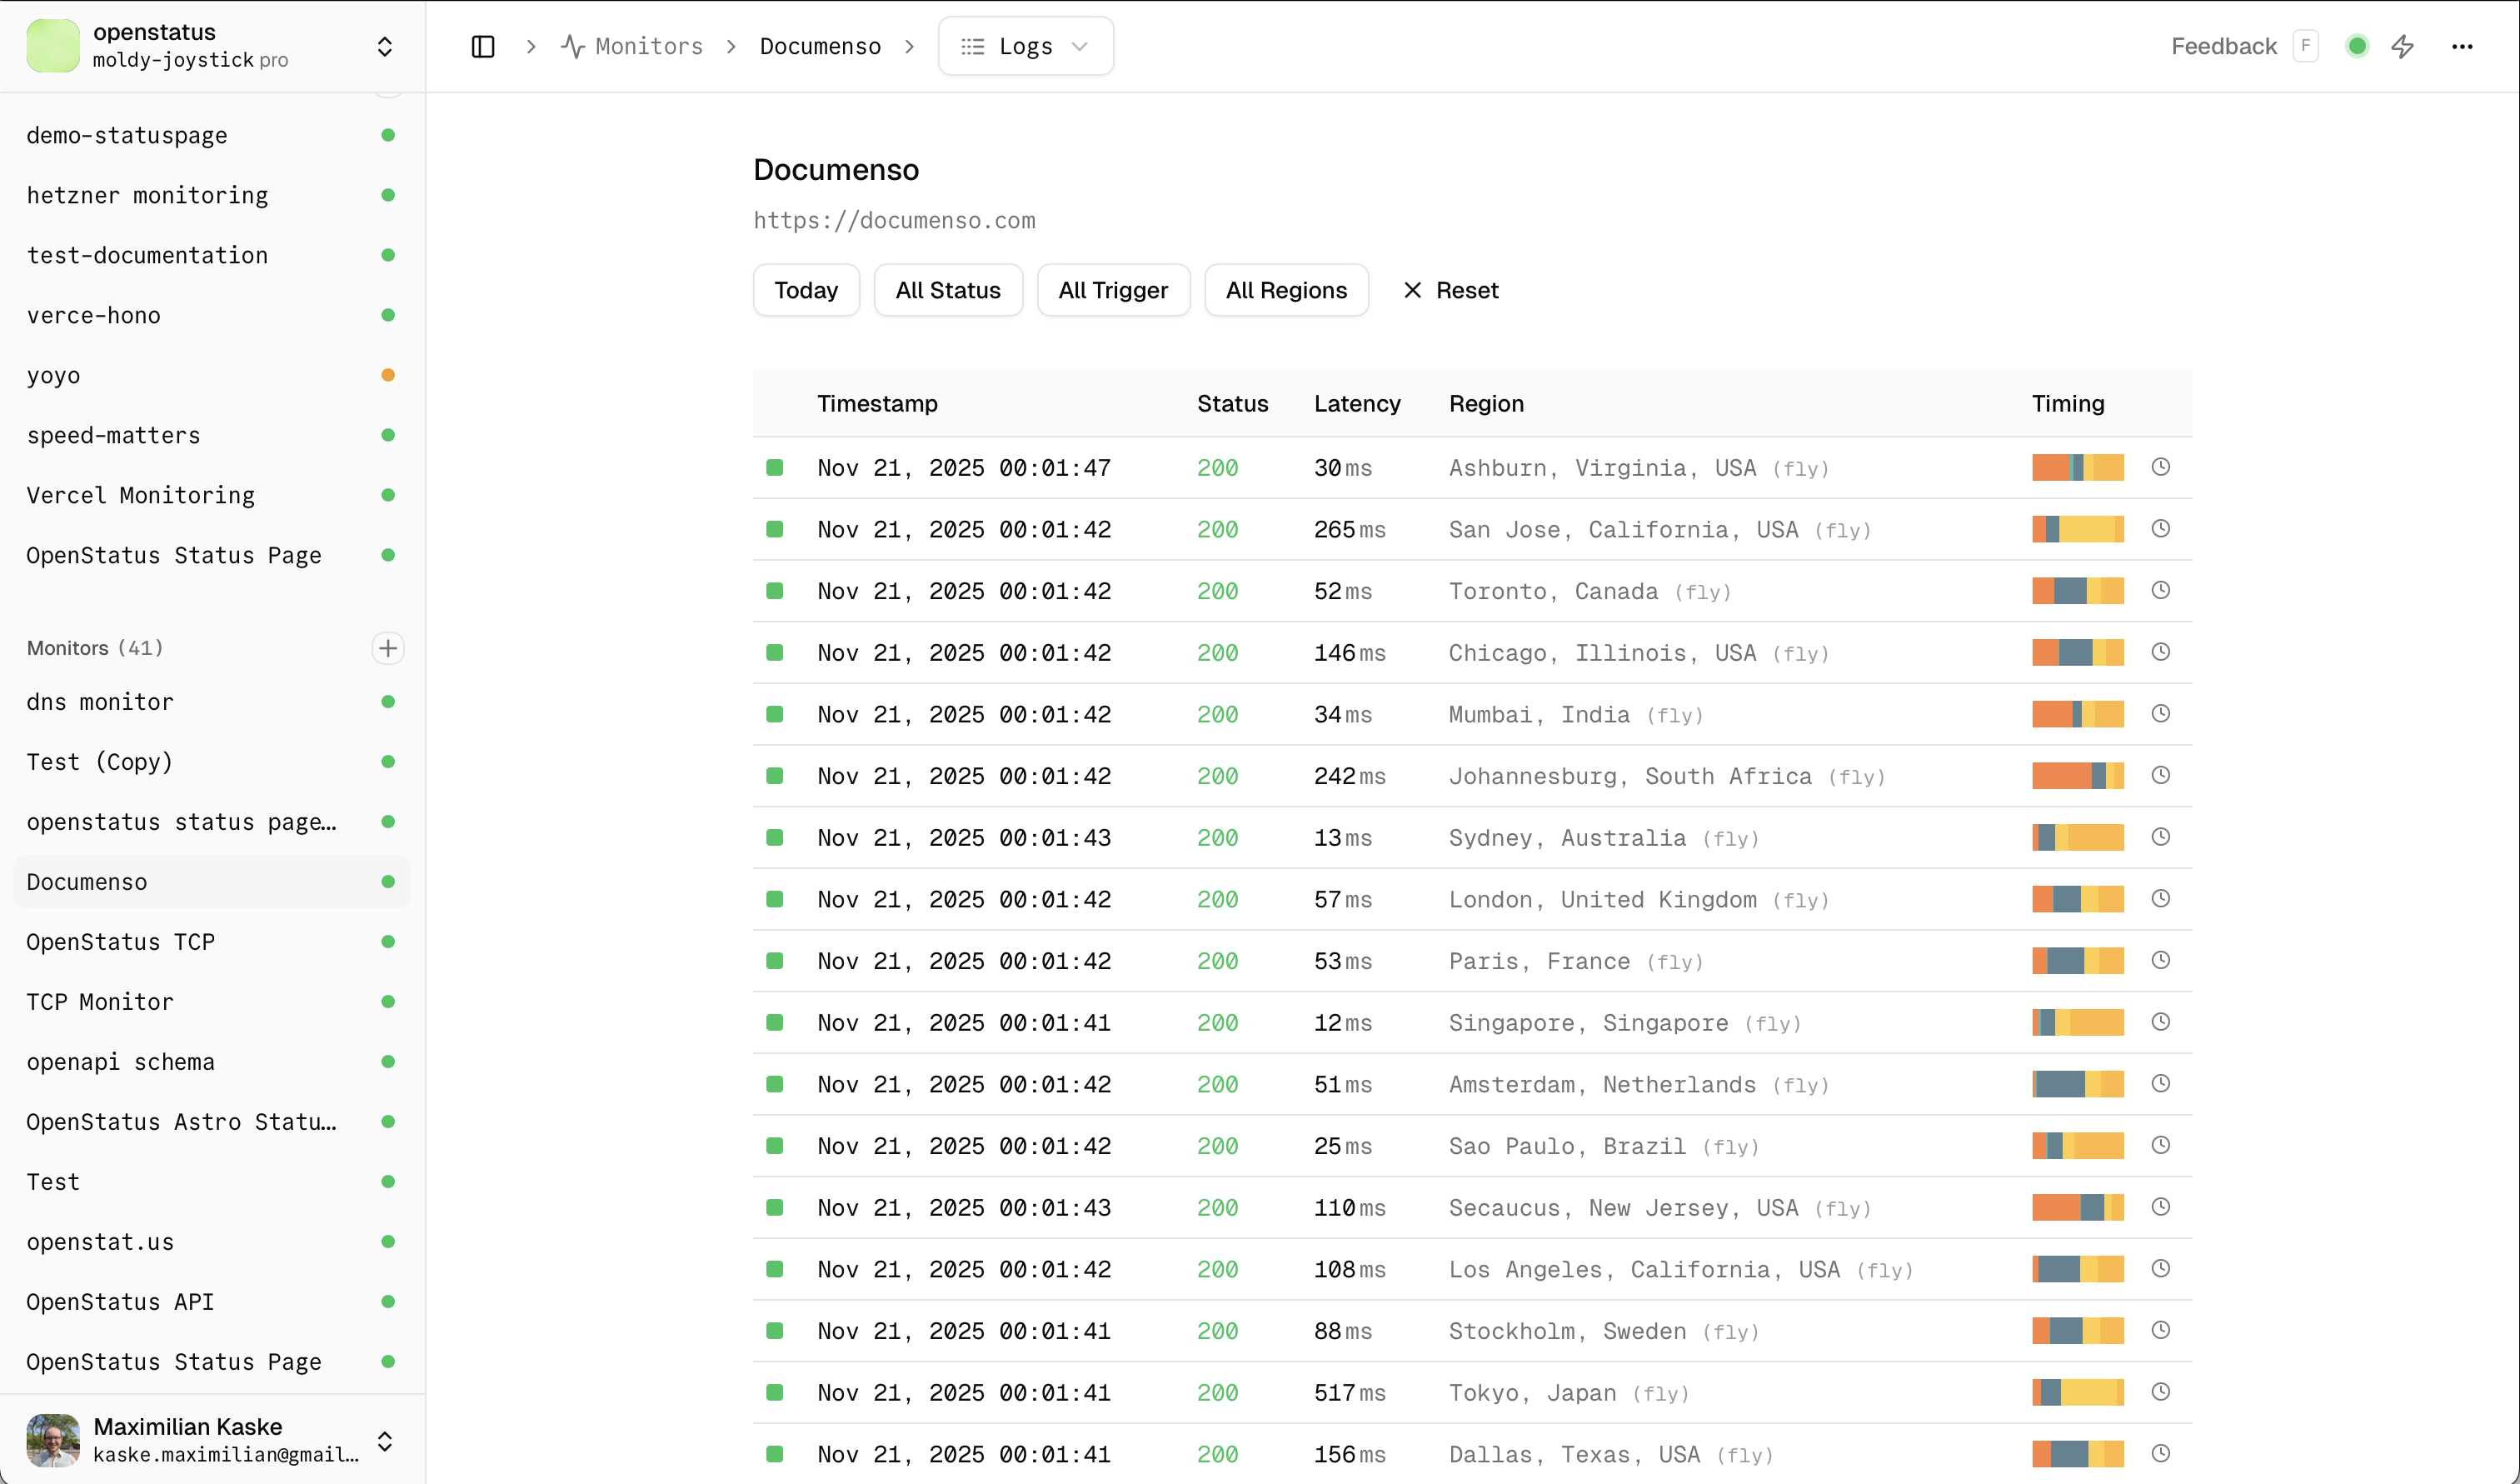
[Go to Dashboard](https://app.openstatus.dev)
## Frequently asked questions
What is openstatus?
Openstatus gives you a branded status page and uptime monitoring that's audit-ready out of the box. Set up status.yourcompany.com, connect your monitors, and start communicating incidents in minutes.
It's open-source, self-hostable, and used by teams like [Cal.com](https://status.cal.com), [WhiteBIT](https://status.whitebit.com), and [Documenso](https://status.documenso.com). Available as a [managed SaaS](https://app.openstatus.dev) or for [self-hosting](https://github.com/openstatushq/openstatus).
Do I need a status page for SOC 2?
SOC 2's CC2.3 criteria requires you to demonstrate incident communication with external parties, but it doesn't prescribe a specific tool. That said, a status page is the **fastest, most auditor-friendly** way to satisfy that requirement.
Every status report on openstatus is **timestamped** and documented automatically, giving you an audit-ready trail of how you communicated during incidents. Most teams set it up in under 10 minutes.
Read more about [SOC 2 status pages](/use-case/compliance).
How does openstatus help with SOC 2 compliance?
Openstatus gives you everything an auditor needs to verify your incident communication process:
- **Branded status page** with custom domain
- **Incident history** with timestamped status reports
- **Subscriber notifications** so stakeholders are proactively informed
- **Maintenance windows** for planned changes
- **Password protection** for internal or client-specific pages
You can be SOC 2-ready in minutes, not weeks.
What does the free plan include?
The free plan includes **one monitor**, **one status page** (with three page components), and a minimum check interval of `10m`. Check the pricing table for a full comparison.
No credit card required. Upgrade or cancel at any time.
Who is behind openstatus?
Openstatus is built by [Thibault](https://bsky.app/profile/thibaultleouay.dev) and [Max](https://x.com/mxkaske), a bootstrapped two-person team building in public.
We're profitable and self-funded, and we'll be here when your next audit comes around.
Read more on [our about page](/about).

What regions does openstatus monitor from?
Openstatus monitors from **28 regions worldwide** across all continents:
**Europe**
Amsterdam 🇳🇱 | Stockholm 🇸🇪 | Paris 🇫🇷 | Frankfurt 🇩🇪 | London 🇬🇧
**North America**
Dallas 🇺🇸 | New Jersey 🇺🇸 | Los Angeles 🇺🇸 | San Jose 🇺🇸 | Chicago 🇺🇸 | Toronto 🇨🇦
**South America**
São Paulo 🇧🇷
**Asia**
Mumbai 🇮🇳 | Tokyo 🇯🇵 | Singapore 🇸🇬
**Africa**
Johannesburg 🇿🇦
**Oceania**
Sydney 🇦🇺
*Need a specific region?* Feel free to [contact us](mailto:ping@openstatus.dev) or join our [Discord](https://discord.gg/openstatus). We're always looking to expand our coverage!
Do you offer annual billing?
Yes. All paid plans are available with **monthly** or **annual** billing. Choose annual billing to get **2 months free**: that's Starter at $300/year ($25/mo) and Pro at $1,000/year (~$83/mo).
You can switch between billing cycles at any time. Check the [pricing page](/pricing) for a full comparison.
Can I self-host openstatus?
Yes. Openstatus is fully open source and can be self-hosted using its **8.5MB Docker image**. You can also deploy **private monitoring locations** behind your firewall to check internal services not exposed to the internet.
- [Self-hosting the full openstatus stack](https://www.openstatus.dev/docs/guides/self-hosting-openstatus/)
- [Self-hosting the status page only](https://www.openstatus.dev/docs/guides/self-host-status-page-only/)
The source code is available on [GitHub](https://openstatus.dev/github).
Does openstatus have an API?
Yes. Openstatus exposes a typed **JSON-over-HTTP API** powered by [ConnectRPC](/blog/migrating-from-zod-openapi-to-connectrpc), with a published [OpenAPI spec](https://api.openstatus.dev/openapi).
Every action in the dashboard (managing monitors, status pages, status reports, maintenance windows, and notification channels) is reachable from the API. The same API key works across the [API](/tooling/api), [CLI](/tooling/cli), Node SDK, [Terraform provider](/tooling/terraform), and [MCP server](/tooling/mcp-server), and every mutation lands in the audit log.
Can I manage openstatus from Claude or ChatGPT?
Yes. Openstatus ships a remote [MCP server](/tooling/mcp-server) at `api.openstatus.dev/mcp` that connects **Claude Desktop**, **ChatGPT**, **Cursor**, and any [Model Context Protocol](https://modelcontextprotocol.io) client to your workspace.
The assistant can list status pages, create and resolve status reports, and schedule maintenance windows. Every publishing tool requires the assistant to explicitly choose whether to notify subscribers (models can't quietly fan out an alert), and every call is recorded in the audit log under `actor_type = 'mcp'`.
Can I manage monitors as code?
Yes. Openstatus offers two ways to treat monitoring as code:
- **YAML + [CLI](/tooling/cli)**: keep your monitor configuration in your repo and sync with `openstatus monitors apply`. Lighter to adopt, ships with a GitHub Action for CI/CD.
- **[Terraform provider](/tooling/terraform)**: for teams already managing infrastructure in HCL. Same plan-and-apply lifecycle as the rest of your stack.
Already have monitors in the dashboard? Run `openstatus terraform generate` from the CLI to bootstrap an HCL file with cross-references and import blocks. No hand-writing required.
---
---
title: "Status Page"
date: Nov 10, 2025
author: "Maximilian Kaske"
description: "Create a public or private status page in minutes. Show real-time uptime, incidents and maintenance on a fully branded page with a custom domain."
category: "Product"
---
## What is a status page?
A status page is a dedicated webpage where companies communicate the real-time health of their services to users. It shows which systems are operational, degraded, or experiencing outages and provides timestamped incident updates so users don't flood your support queue. Status pages build trust through transparency and satisfy compliance requirements like SOC 2 CC2.3.
Status pages can be **public** (customer-facing) or **private** (internal teams or specific clients).
A typical status page includes:
- **Real-time operational status** for each service or component
- **Timestamped incident updates** from investigating through resolution
- **Subscriber notifications** via email, RSS, or webhook
- **Uptime history** showing reliability over time
Free to start. Paid plans from $30/mo.
## Trusted by teams who ship transparency
## Why do you need a status page?
**It deflects support load.** During an outage, every user asks the same question: is it down, or is it me? Without somewhere to point them, that question arrives one ticket at a time while your team is already busy fixing the thing. A status page answers it once, for everyone. See [reducing support tickets](/use-case/reduce-support-tickets).
**Enterprise buyers ask for one.** Security questionnaires and vendor reviews routinely ask how you notify customers during an incident. "We email the affected accounts" is a weaker answer than a public URL with a year of incident history behind it. See [status pages for enterprise sales](/use-case/enterprise-sales).
**Auditors want the evidence.** SOC 2's CC2.3 criteria asks you to demonstrate that you communicate incidents to external parties. Every status report on openstatus is timestamped and archived automatically, so the trail already exists when the auditor asks for it. See [status pages for compliance](/use-case/compliance).
**Uptime Status Page**

**Events Page**
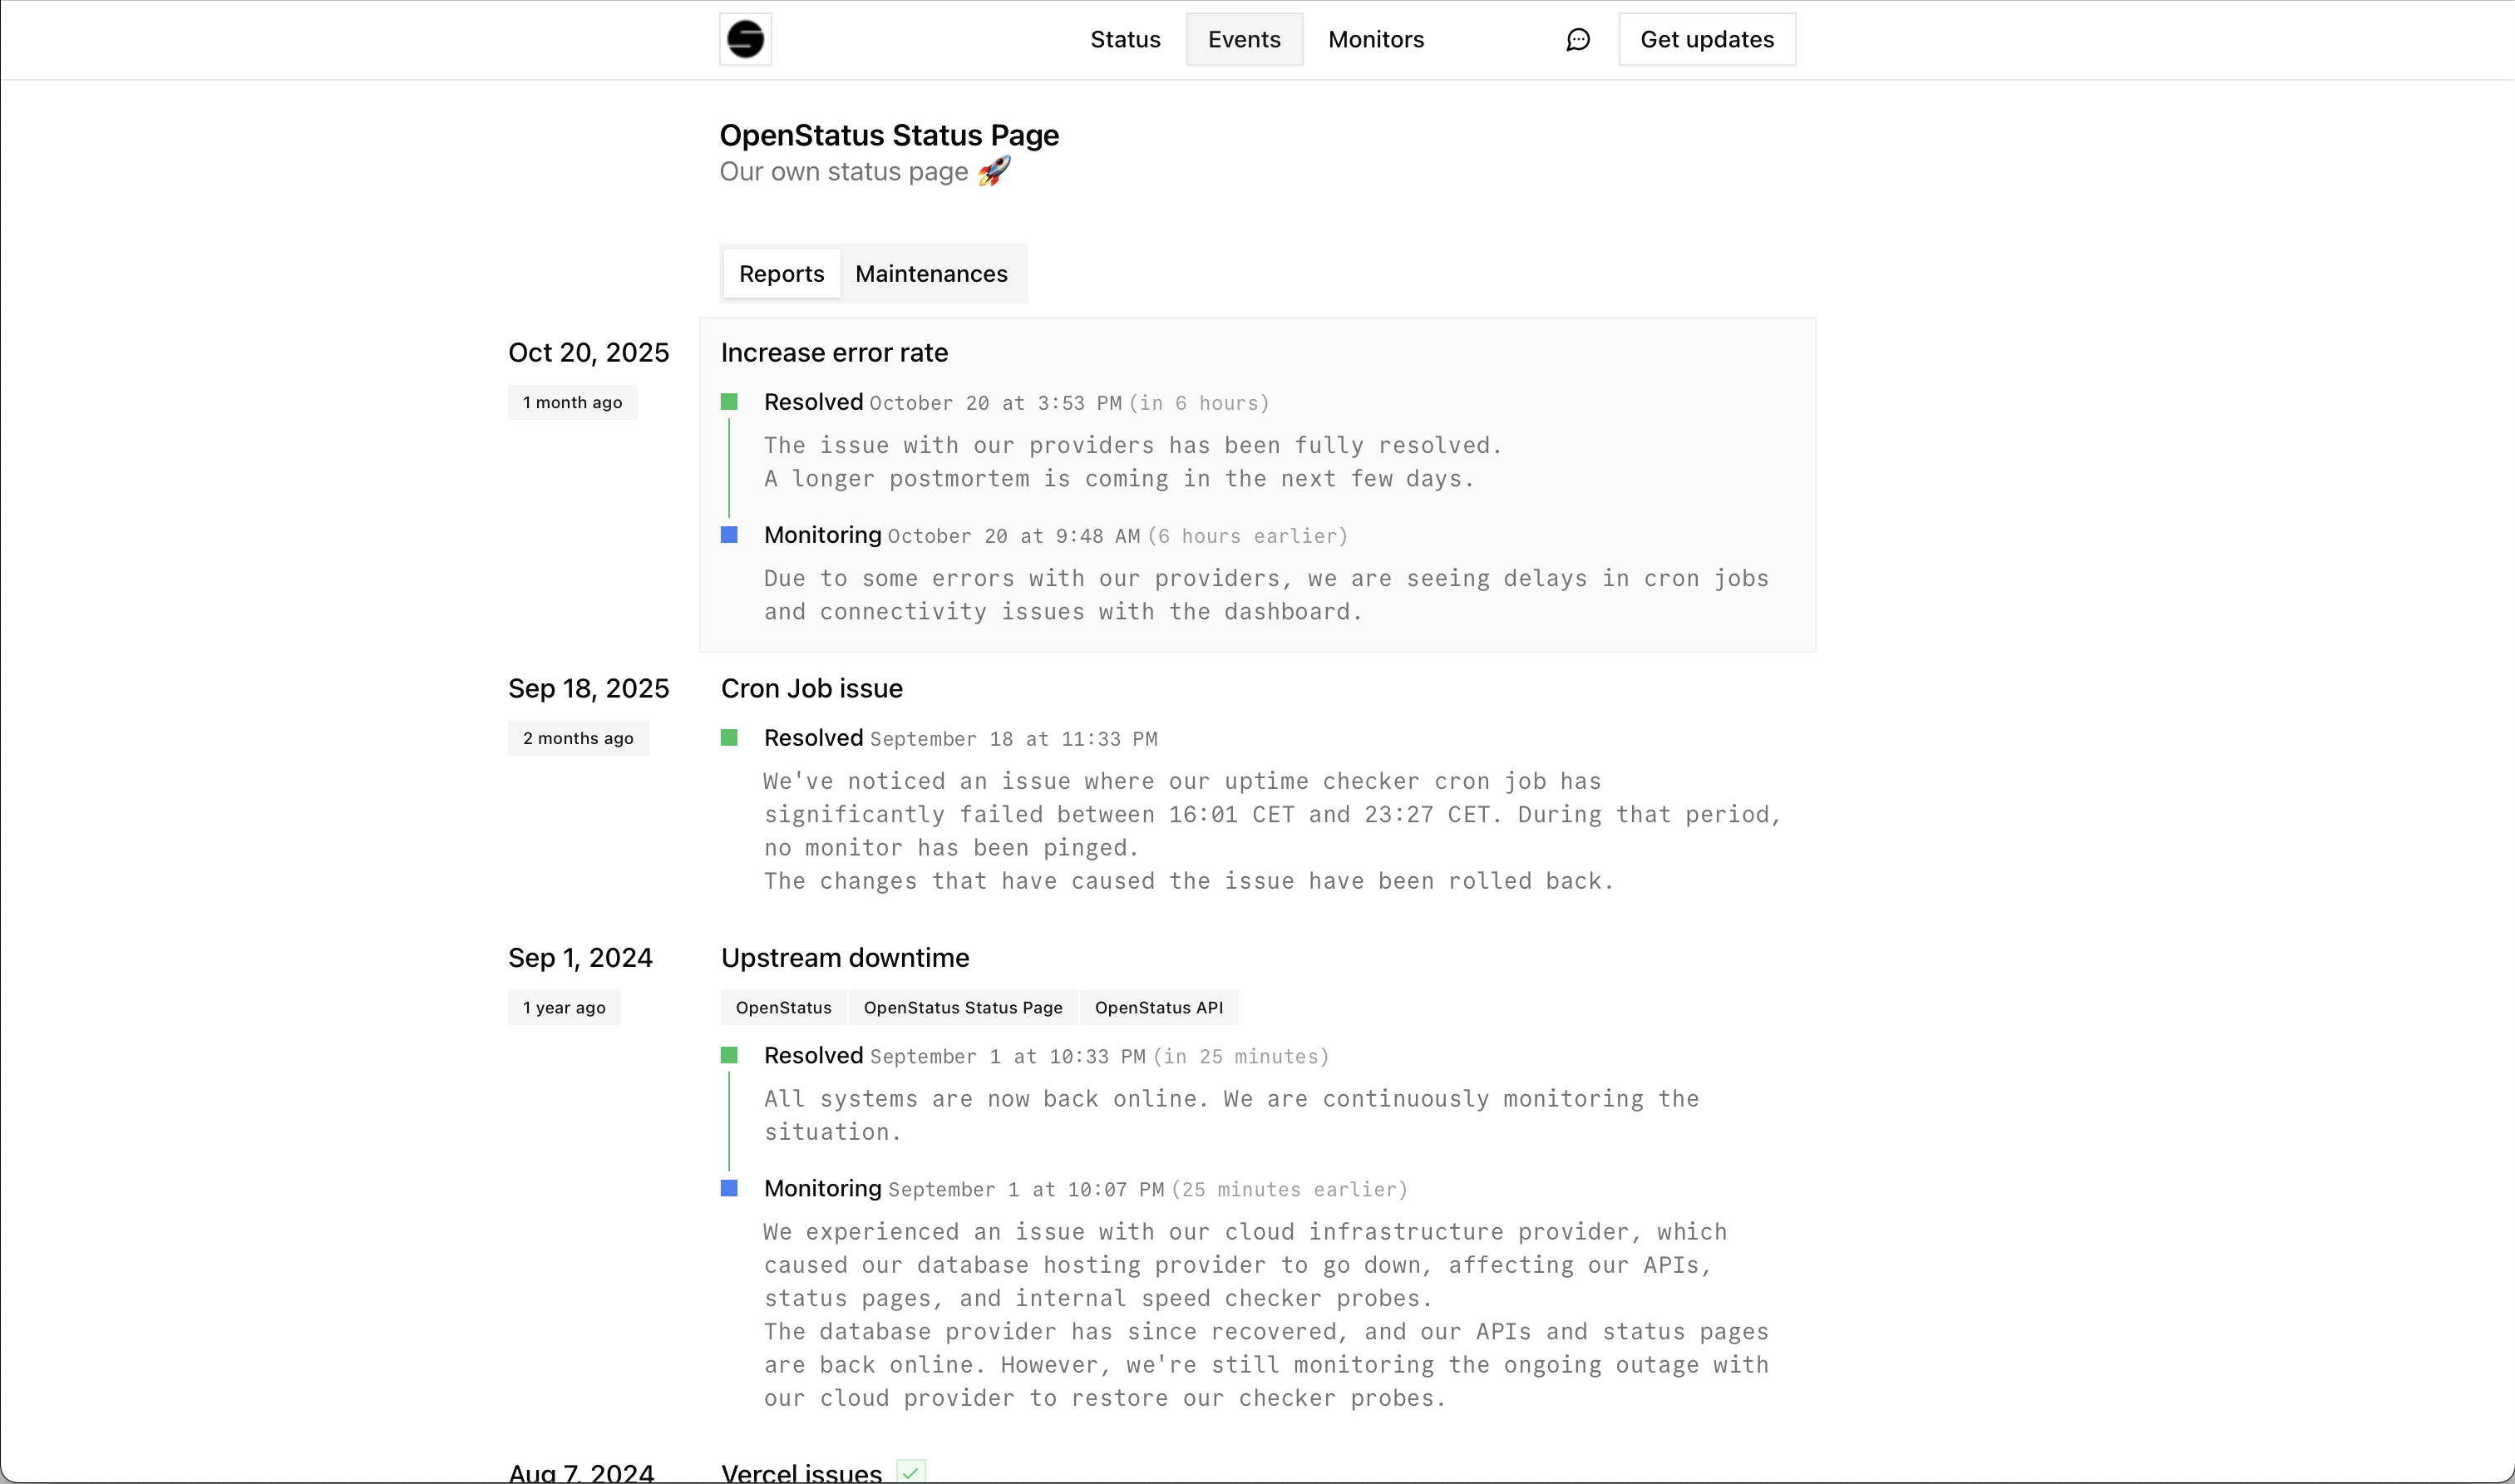
## Why choose openstatus for your status pages?
We provide you with a good **mix of customization and opinionated options**.
### Page Components
You can attach specific monitors to a status page. You can either populate the data from the **aggregated uptime** data **or manually** manage them. Read more [about uptime monitoring](/uptime-monitoring).
Page components provide a **flexible structure** that supports both:
- **Monitors**: Automatically synced with your uptime monitoring data
- **External Services**: Manually managed components for third-party services or systems you don't directly monitor
You can **group page components** by their services, locations, or any logical grouping, and they will be collapsible for better organization.
### Links
Add a **Get in touch** in touch button and add a specific **website** link or a **`mailto:`** address.
Include a **homepage** link to redirect the user to your page on clicking on the left-hand nav icon.
### Subscriptions
Allow your users **subscribe** to your status page, to automatically receive **updates** whenever you add a status report or maintenance to your status page.
We support following communication channels:
- **Emails**
- **RSS/Atom feeds**
- **JSON**
[Contact us](mailto:ping@openstatus.dev) if you are looking for specific a channel.
### Translations
Offer your status page in **multiple languages**. Set a default locale and enable a **locale switcher** so visitors can read updates in their preferred language. Currently supports English, French, German, Turkish, Hindi, Korean, and Japanese — with more languages coming from community contributions.
### Slack Agent
Manage incidents without leaving Slack. Install the **@openstatus** Slack agent and @mention it in any channel or thread to create, update, and resolve status reports using plain language - no slash commands, no tab switching.
> **@openstatus** our API is returning 500 errors for about 10% of requests. Can you create an incident on the status page?
The agent reads the conversation, looks up your status pages and components, and drafts a status report. Before anything goes public it posts a confirmation card so you can review the title, status, and message. Choose to **Approve**, **Approve & Notify** (sends notifications to all subscribers), or **Cancel**.
The agent is **thread-aware**: when you follow up in the same thread (_"we found the root cause"_ or _"it's fixed"_), it picks up the context and drafts the next update automatically. The entire incident lifecycle - from creation to resolution - can happen in a single Slack thread.
### Import from Another Provider
Already using Atlassian Statuspage, Better Stack, or Instatus? Import your entire setup -- components, component groups, incidents, maintenances, subscribers, and monitors -- in minutes. Open a status page, go to the **Components** tab, scroll down to the **Import** section, paste your API key, preview what will be imported, and confirm.
Read the [migration guides](/blog/import-from-statuspage-betterstack-instatus) for details on each provider.
## Branded status pages
Match your brand **appearance** by contributing your own theme to the community. We have build a **[Theme Store](https://themes.openstatus.dev)** that helps you create and use custom themes on your status page. Contribute your own theme. If you a private custom theme let us know via [email](mailto:ping@openstatus.dev?subject=Private%20Theme).
You can **define the values** you want to share with your users. If can decide between duration values/uptime ping values or purely based on manual status report updates.
You can create **custom domains** to keep the domain your users are used to.
## Internal & private status pages
By default, your status page is public. For internal or client-specific pages, you can protect access using **password protection**, **magic link** authentication, or **IP restriction** (CIDR-based network allowlist) to control who can view your updates.
Free to start. Paid plans from $30/mo.
## Frequently asked questions
What is a status page?
A status page is a dedicated webpage where companies communicate the real-time health of their services to users. It shows which systems are operational, degraded, or experiencing outages, and provides timestamped incident updates. Status pages reduce support tickets during incidents, build user trust through transparency, and satisfy compliance requirements like SOC 2.
When should I use a public vs private status page?
Use public status pages for customer-facing services where transparency builds trust. Use private status pages (password-protected, magic link, or IP-restricted) for internal tools, client-specific deployments, or when you need to control who receives status updates.
What's the difference between monitors and external services in page components?
Monitors are automatically synced with your OpenStatus uptime monitoring data and update in real-time. External services are manually managed components for third-party dependencies or systems you don't directly monitor but want to report status for.
Can I translate my status page into other languages?
Yes, status pages support multiple languages (currently English, French, German, Turkish, Hindi, Korean, and Japanese). You can set a default locale and enable a locale switcher so visitors choose their preferred language. Translations are open source — you can contribute new languages by adding a locale to the shared registry and running the dev server to generate the translation file.
Can I use my own domain for the status page?
Yes, you can configure custom domains to host your status page on your own domain (e.g., status.yourcompany.com) instead of the default OpenStatus subdomain. This keeps the experience consistent with your brand.
How do status page subscriptions work?
Users can subscribe to receive updates when you post status reports or maintenance notices. We support email notifications, RSS/Atom feeds for feed readers, and JSON feeds for programmatic consumption. Subscribers are automatically notified when you publish updates.
Can I customize the appearance of my status page?
Yes, use the Theme Store to apply community themes or create your own. Themes control colors, fonts, and layout. For private custom themes, contact us. You can also define which data to share (uptime percentages, response times, or manual reports only).
How do I create a status page?
Sign up, create a status page, give it a name and a slug, then add page components — either monitors synced from your uptime monitoring or external services you manage by hand. Point a custom domain at it if you want status.yourcompany.com, pick a theme, and publish. Most teams are live in under ten minutes on the free plan.
Public vs internal status page?
A public status page is customer-facing and indexed — it deflects support tickets and answers vendor questionnaires. An internal or private status page is for staff, contractors, or a single client, and access is controlled with password protection, magic link authentication, or an IP allowlist. You can run both from the same workspace.
How much does a status page cost?
The free Hobby plan includes one status page with three components and no credit card. Paid plans start at $30/month for Starter (one status page, 20 components, custom domain, subscribers), $100/month for Pro, and $500/month for Scale. Annual billing gives you two months free. Extra status pages are $20/month each.
What is the Slack agent and what can it do?
The Slack agent lets you manage your status page directly from Slack using natural language. @mention @openstatus in any channel or thread to create incidents, post updates, and resolve reports — without leaving Slack. No slash commands required.
---
---
title: "Uptime Monitoring"
date: Nov 10, 2025
author: "Thibault Le Ouay Ducasse"
description: "Monitor your websites, APIs and services from 28 regions. Get alerted the moment a check fails an assertion or exceeds your threshold."
category: "Product"
---
## Why is uptime monitoring important?
Uptime monitoring is the practice of continuously asking one question on your users' behalf: is this service working right now? Instead of waiting for a customer to report a problem, checks run on a schedule from outside your own network and tell you the moment the answer changes.
It answers three things a dashboard inside your own infrastructure cannot:
1. **Is my service reachable?** Can users actually get to it, from where they are?
2. **Is it fast enough?** Are response times inside the range you promised?
3. **Is it correct?** Is it returning the data you expect, not just a 200?
That external vantage point is the whole point. If your service runs on the same infrastructure as your monitoring, an outage that takes down one takes down the other — and you find out from your customers instead.
[Free to start. Paid plans from $30/mo.
## Trusted by teams who ship transparency
## How uptime monitoring works
```
+----------------+
| Service to be |
| Monitored |
+----------------+
▲
|
| (Network Latency/Failures)
|
+-----+-------+ +-----+-------+ +-----+-------+
| Monitoring | | Monitoring | | Monitoring |
| Node (USA) | | Node (EU) | | Node (Asia) |
+-----+-------+ +-----+-------+ +-----+-------+
| | |
|---------------|-----------------|
▼ ▼ ▼
+------------------------------------------------+
| openstatus |
| |
| - Sends automated requests (e.g., pings or |
| HTTP checks) from all nodes at set intervals |
| - Records response time and success/failure |
| - Compares results from different nodes |
| - If a failure or a slow response is detected, |
| it triggers an alert. |
+------------------------------------------------+
|
| (Alerts: Email, SMS, Slack, etc.) 🔔
|
+-----+-----+
| Your Team |
+-----------+
```
**Uptime Dashboard**
**Response Logs**
## Why choose openstatus for uptime monitoring?
### Global Monitoring
You can monitor your services from multiple regions around the world. We currently have our probes deployed in **28 regions**.
Check all regions in the [global speed checker](/play/checker).
### Multi Cloud
You should avoid monitoring your services from the same cloud providers you use for those services. That's why our probes are deployed across three different cloud providers:
- **Fly.io**
- **Koyeb**
- **Railway**
### API Monitoring
Monitor any HTTP/HTTPS endpoint including REST APIs, GraphQL APIs, webhooks, and third-party service endpoints. Openstatus supports all HTTP methods and custom headers for authentication.
#### Assertions
Validating your response can be important. You can do **status code**, **header** or **body text** assertions. Read more [in the docs](https://www.openstatus.dev/docs/reference/http-monitor/#assertions).
#### Thresholds
You can set a **degraded at** and **timeout** threshold whenever required. We will send you a notification whenever the responses exceed the thresholds.
#### Open Telemetry
When needed, you can export to your **OTLP endpoint** the metrics for every request we do. Access the data and set yourself an **alert channel** in Grafana, Honeycomb etc. Read more [in our guide](https://www.openstatus.dev/docs/guides/how-to-export-metrics-to-otlp-endpoint/).
### Notification channels
Set different notification channels and **get notified** whenever a response fails your assertions or exceeds your thresholds.
We support:
- Socials: Slack, Discord, Telegram Bot, Google Chat, Microsoft Teams
- Direct: Email, SMS, WhatsApp
- Incident Management: OpsGenie, PagerDuty, Grafana OnCall
- Custom: Webhook, Ntfy
### Status Pages
Automatically update your status page based on your uptime monitoring results. Push reports and communicate with your users during incidents. You can choose to **share response details** on your status page. Read more [about status pages](/status-page).
### Monitoring as Code
The best way to **version** your monitor changes is via the openstatus CLI and its **`YAML` config**. Additionally, we provide a [Terraform Provider](https://registry.terraform.io/providers/openstatusHQ/openstatus/latest).
```yaml
# yaml-language-server: $schema=https://www.openstatus.dev/schema.json
uptime-monitor:
name: "Graphql"
description: "GitHub GraphQL API"
frequency: "10m"
active: true
regions:
- iad
- ams
- syd
- jnb
- gru
retry: 3
kind: http
request:
url: https://api.github.com/graphql
method: POST
headers:
User-Agent: OpenStatus
Authorization: Bearer YOUR_TOKEN_HERE
body: |
{
"query": "query { viewer { login }}"
}
```
Once set, apply your changes via [CLI](https://www.openstatus.dev/docs/tutorial/get-started-with-openstatus-cli/):
```bash
openstatus monitors apply
```
Check our [GitHub repository](https://github.com/openstatusHQ/cli-template) to see the `YAML` templates of how to monitor **MCP**, **GraphQL**,... endpoints. We also provide a simple [GitHub Action](https://github.com/marketplace/actions/openstatus-synthetics-ci) to run it in your **CI/CD**.
### Private Locations
Sometimes the services you want to monitor are not accessible from the outside. Simply **deploy our probes** to your favorite **cloud provider**, your own **server** or on your own **virtual private cloud** (VPC).
The docker image is only **8.5MB** small and should easily fit on your infrastructure whether ARM64 or AMD64.
```bash
docker pull ghcr.io/openstatushq/private-location:latest
```
```bash
docker run -d \
--name openstatus-private-location \
--restart=always \
-e OPENSTATUS_KEY=$OPENSTATUS_KEY \
ghcr.io/openstatushq/private-location:latest
```
You can read more here:
- [Cloudflare Containers guide](https://www.openstatus.dev/docs/guides/how-to-deploy-probes-cloudflare-containers/)
- [Raspberry Pi deployment](/blog/deploy-private-locations-raspberry-pi)
- [Private location docs](https://www.openstatus.dev/docs/guides/how-to-create-private-location/)
**Status Page Monitors**
## Frequently asked questions
Uptime monitoring is the practice of checking, on a fixed schedule and from outside your own network, whether a service is reachable and responding correctly. Checks typically run every 30 seconds to 10 minutes from probe locations around the world. Because the checks originate externally, they catch failures your internal dashboards cannot see — DNS problems, expired certificates, and regional outages.
Match the frequency to the cost of the outage. Revenue-critical endpoints justify 30-second checks; internal tooling is usually fine at 5 or 10 minutes. Higher frequency shortens the time between a failure starting and you hearing about it, but consumes more of your check quota. openstatus supports 30s, 1m, 5m and 10m intervals depending on your plan.
Uptime is what your monitor measures: the proportion of checks that succeeded. Availability is what your users experienced, which includes degraded performance your checks may have passed. A service returning HTTP 200 in eight seconds is up but arguably not available. This is why thresholds matter alongside assertions — they let you count slow responses as degraded rather than healthy.
Yes. Deploy a private location probe inside your network as an 8.5MB Docker container and it appears as another monitoring region in your dashboard. The probe reaches out to openstatus, so no inbound firewall rule is needed. You can run as many private locations as you like across different VPCs or networks.
Create an HTTP monitor pointing at the endpoint, choose the method, and add any headers your API needs for authentication. For GraphQL, send a POST with the query in the body. Then add assertions on the status code, response headers, or body content so the monitor verifies the response is correct rather than merely present, and set a threshold so slow responses register as degraded.
The free Hobby plan includes one monitor at a 10-minute interval with no credit card. Paid plans start at $30/month for Starter (20 monitors, 1-minute checks, 6 regions per monitor), $100/month for Pro (50 monitors, 30-second checks, all 28 regions), and $500/month for Scale. Annual billing gives you two months free.
Start with 3-5 regions covering your main user geographies. More regions provide better global coverage but use more check quota. For critical services, monitor from all major regions (North America, Europe, Asia) to catch regional issues quickly.
If your service runs on AWS and your monitoring also runs on AWS, you won't detect AWS-wide outages or network issues affecting AWS connectivity. Using Fly.io, Koyeb, and Railway ensures monitoring independence from your infrastructure provider.
Frequency determines how often we check your service (e.g., every 30 seconds, 1 minute, 5 minutes, 10 minutes). Higher frequency (30s) catches issues faster but uses more checks. Lower frequency (10m) is sufficient for non-critical services and conserves quota.
Yes, you can configure monitors to automatically update your status page based on monitoring results. When assertions fail or thresholds are exceeded, the status page can reflect degraded or down status without manual intervention.
Assertions validate response correctness (status code, headers, body content) while thresholds define performance boundaries (degraded latency, timeout). Both can trigger alerts - assertions catch functional failures, thresholds catch performance degradation.
You can monitor any HTTP/HTTPS endpoint including REST APIs, GraphQL APIs, webhooks, and third-party service endpoints. Openstatus supports all HTTP methods (GET, POST, PUT, DELETE, etc.) and custom headers for authentication.
Use YAML + CLI for simplicity and if you're not already using Terraform. It's lightweight and easy to get started. Choose Terraform if you're managing infrastructure as code and want to integrate monitoring into your existing Terraform workflows for unified state management.
Yes, you can deploy as many private location probes as needed across different networks, VPCs, or regions. Each gets its own API key and appears as a separate monitoring region in your dashboard. The Docker image is only 8.5MB and supports ARM64 and AMD64.
---
Free to start. Paid plans from $30/mo.
---
Check your website's latency
Global Speed Checker](https://app.openstatus.dev?ref=uptime-monitoring-top)
---
---
---
title: "API"
date: Apr 29, 2026
author: "Maximilian Kaske"
description: "A typed JSON-over-HTTP API powered by ConnectRPC — every endpoint the dashboard uses, with a fully typed Node SDK on top."
category: "Product"
---
The openstatus API is a typed, JSON-over-HTTP layer powered by [ConnectRPC](/blog/migrating-from-zod-openapi-to-connectrpc). Every action the dashboard performs is reachable from the API — same workspace, same audit log, same single API key.
## Quickstart
```bash
curl https://api.openstatus.dev/rpc/openstatus.v1.MonitorService/ListMonitors \
-H "x-openstatus-key: os_xxxxxxxxxxxxxxxxxxxxxxxxxxxxxxxx" \
-H "Content-Type: application/json" \
-d '{}'
```
Generate a key from **Settings > API Tokens**.
## What you can do
- Manage monitors, status pages, status reports, maintenance windows, and notification channels.
- Build dashboards or in-app integrations on top of typed JSON responses.
- Use a single key across the API, CLI, Terraform, and MCP server.
- Inspect the full schema in the [OpenAPI explorer](https://api.openstatus.dev/openapi).
## Node SDK
The [openstatus Node SDK](https://github.com/openstatusHQ/sdk-node) is a fully typed TypeScript and JavaScript client for the API — no hand-written `fetch` calls, no codegen step. Works in Node and Deno.
```bash
npm i @openstatus/sdk-node
```
```ts
const client = new Openstatus({ apiKey: process.env.OPENSTATUS_API_KEY });
const monitors = await client.monitors.list();
await client.statusReports.create({ /* ... */ });
```
[Reach out](mailto:ping@openstatus.dev) if you want us to port it to another language.
## Auth & audit
Pass `x-openstatus-key` on every request. The token is the same one the CLI, Terraform provider, and MCP server share.
Every mutation lands in the audit log under `actor_type = 'api'`, so you can trace any change back to a key, a user, and a transport.
## Other surfaces
- Want a terminal interface or YAML config? See the [CLI](/tooling/cli).
- Managing infrastructure in HCL? Use the [Terraform provider](/tooling/terraform).
- Want Claude or ChatGPT to call your workspace? See the [MCP server](/tooling/mcp-server).
## Reference
Full schema and methods in the [API reference](https://api.openstatus.dev/openapi). SDK docs at [jsr.io/@openstatus/sdk-node](https://jsr.io/@openstatus/sdk-node).
## Frequently asked questions
Should I use the SDK or call the API directly?
Use the Node SDK if you're writing TypeScript or JavaScript — it handles auth, retries, and types for every endpoint. Call the API directly via curl or your language's HTTP client if you're outside the JS ecosystem; ConnectRPC means responses are plain JSON over HTTP.
Is the API REST or RPC?
It's ConnectRPC — JSON over HTTP, but with a typed RPC contract instead of REST conventions. Every method is a POST to `/rpc/openstatus.v1./`. You can call it from curl exactly like you'd call a REST endpoint.
How do I authenticate?
Pass the x-openstatus-key header on every request. Generate a key from Settings > API Tokens — the same key works for the CLI, Terraform provider, and MCP server.
Do you publish an OpenAPI spec?
Yes. The full schema is browsable at api.openstatus.dev/openapi and is the source of truth for the Node SDK and any generated clients.
---
---
title: "CLI"
date: Apr 29, 2026
author: "Maximilian Kaske"
description: "Manage monitors, status pages, and incidents from your terminal — interactive for humans, scriptable for agents, and YAML-managed for monitoring as code."
category: "Product"
---
The openstatus CLI is the terminal interface to your workspace. It works for both humans (interactive wizards, colors, spinners) and agents (`--json`, deterministic flags, structured errors) — and it lets you keep your monitor configuration as YAML in your repo.
## Quickstart
```bash
brew install openstatusHQ/cli/openstatus --cask
openstatus login
openstatus whoami
openstatus monitors apply
```
Set `OPENSTATUS_API_TOKEN` to skip the login flow in CI.
## What you can do
- Manage monitors, status pages, status reports, and maintenance windows.
- Sync a YAML config with `openstatus monitors apply` — monitoring as code, no HCL required.
- Bootstrap a Terraform configuration from your workspace with `openstatus terraform generate`.
- Pipe `--json` output into `jq`, agents, or your own scripts.
## GitHub Action
Run the CLI from a workflow with the published [GitHub Action](https://github.com/openstatusHQ/cli-action) — drop it into your release pipeline to apply monitor config changes, trigger synthetic checks on deploy, or fail a deploy when a probe regresses.
```yaml
- uses: openstatusHQ/cli-action@v1
with:
api-token: ${{ secrets.OPENSTATUS_API_TOKEN }}
args: monitors apply
```
## AI skills
[Openstatus skills](https://github.com/openstatusHQ/skills) are agent-ready bundles that wrap the CLI for terminal-shaped AI workflows like Claude Code. Install once, then let your agent draft incidents, schedule maintenance, and post status updates on your behalf.
```bash
npx skills add openstatushq/skills
```
You get incident communication templates, maintenance announcement drafts, periodic status reports, and shared status-page context so every skill speaks in your voice.
## Auth & audit
Authenticate with `openstatus login` (browser flow) or `OPENSTATUS_API_TOKEN` (CI). The token is the same one the API, Terraform provider, and MCP server share — generate it from **Settings > API Tokens**.
Every mutation lands in the audit log under `actor_type = 'cli'`, so you can trace any change back to a key, a user, and a transport.
## Other surfaces
- Want chat-shaped AI access from Claude or ChatGPT? See the [MCP server](/tooling/mcp-server).
- Already managing infrastructure in HCL? Use the [Terraform provider](/tooling/terraform).
- Building an in-app integration? Call the [API](/tooling/api) directly.
## Reference
Full command list and flags in the [CLI reference](https://www.openstatus.dev/docs/reference/cli-reference/).
## Frequently asked questions
Is the CLI suitable for AI agents?
Yes. Every command supports --json output and structured errors, and required flags fail with a clear list of what's missing instead of hanging in a wizard. Combined with our agent skills, the CLI is the recommended way to give AI agents scriptable control over openstatus.
Can I run the CLI in CI?
Yes. Set `OPENSTATUS_API_TOKEN`, use the `--json` flag for parseable output, and run `openstatus monitors apply` to sync your YAML config. We also publish a GitHub Action that wraps the CLI for synthetic tests.
What's the difference between the CLI's YAML config and the Terraform provider?
Both treat monitoring as code. The YAML config is lighter to adopt and lives next to your repo. Terraform is the right choice when monitors are part of a larger HCL-managed infrastructure. Run `openstatus terraform generate` to bootstrap an HCL file from your existing workspace if you want to migrate.
Are skills different from the MCP server?
Skills are prompt and command bundles installed into your local agent (Claude Code, etc.) that wrap the openstatus CLI. The MCP server is a remote endpoint that any MCP-compatible client can connect to. Skills are great for terminal-shaped workflows; MCP is great for chat-shaped workflows.
---
---
title: "MCP Server"
date: Apr 29, 2026
author: "Maximilian Kaske"
description: "Connect Claude, ChatGPT, Cursor, and any other Model Context Protocol client to your workspace — sign in with OAuth, pick a workspace, and get audit-logged mutations with explicit notify semantics."
category: "Product"
---
The openstatus MCP server connects Claude Desktop, ChatGPT, Cursor, and any other [Model Context Protocol](https://modelcontextprotocol.io) client to your workspace — so an AI assistant can read monitors, response logs, and audit history, and drive status pages, status reports, and maintenance windows directly from a conversation.
## Quickstart
```
https://api.openstatus.dev/mcp
```
Add the URL as a custom connector in Claude, ChatGPT, or Cursor, or run `claude mcp add --transport http openstatus https://api.openstatus.dev/mcp` for Claude Code. The client opens a consent screen, you pick a workspace and an access level, and the openstatus tools appear in the picker. The server is stateless Streamable HTTP and scales horizontally.
## What you can do
The server exposes **19 tools** scoped to your workspace, grouped by entity:
- **Status pages** — `list_status_pages` · `list_page_components`
- **Status reports** — `list_status_reports` · `create_status_report` · `add_status_report_update` · `update_status_report` · `resolve_status_report`
- **Maintenance** — `list_maintenances` · `create_maintenance`
- **Monitors** — `list_monitors` · `get_monitor` · `get_monitor_status` · `get_monitor_summary`
- **Response logs** — `list_response_logs` · `get_response_log`
- **Notifications** — `list_notifications`
- **Private locations** — `list_private_locations`
- **Audit log** *(workspaces on the audit-log plan only)* — `list_audit_logs` · `get_audit_log`
The four **publishing** tools (`create_status_report`, `add_status_report_update`, `resolve_status_report`, `create_maintenance`) require `notify: true | false` — the assistant must explicitly choose whether to notify subscribers, so an LLM cannot quietly fan out an alert. `update_status_report` is metadata-only and cannot notify.
The same tool registry powers the [in-app assistant](/blog/from-clickops-to-chatops) — every tool you see in `/chat` is the same tool you call over MCP, kept in sync by shape-equivalence tests.
## Auth & scopes
The MCP server is an OAuth 2.1 authorization server. Connect from any client that implements the MCP authorization spec and you get a consent screen instead of a key to paste: pick the **workspace** and choose **Read-only** or **Read & write**. Tokens rotate automatically, and every connection is listed under **Settings > Integrations > Connected apps**, where it can be revoked with immediate effect.
For CI and headless agents, the `x-openstatus-key` header still works — the same API key the CLI, API, and Terraform use, from **Settings > API Tokens**.
Both credentials carry a `read` or `write` scope. Read-only connections never see write tools in `tools/list` — they don't exist for that session. Write tools throw a clean error if a read-only credential somehow attempts them.
Every mutation lands in the audit log under `actor_type = 'mcp'`, so you can trace any change back to a connection, a user, and a transport.
## Other surfaces
- Want chat inside the dashboard instead of an external client? See the [in-app assistant](/blog/from-clickops-to-chatops).
- Want a terminal interface for AI agents (Claude Code, etc.)? See [skills](/tooling/cli#ai-skills) on the CLI page.
- Building an in-app integration? Call the [API](/tooling/api) directly.
- Want Slack instead of Claude or ChatGPT? See the [Slack agent](/status-page#slack-agent).
## Setup guides
- [Claude Code](/guides/connect-openstatus-to-claude-code) · [Claude Desktop](/guides/connect-openstatus-to-claude-desktop)
- [Codex](/guides/connect-openstatus-to-codex) · [ChatGPT](/guides/connect-openstatus-to-chatgpt)
- [opencode](/guides/connect-openstatus-to-opencode)
## Reference
Full tool schema, error codes, and per-client config in the [MCP reference](/docs/reference/mcp-server/).
## Frequently asked questions
What does the MCP server let an assistant do?
The MCP server exposes 19 read and write tools scoped to your workspace: list status pages, monitors, response logs, notifications, private locations, and audit logs; inspect a single monitor or response log; create, update, and resolve status reports; schedule maintenance windows. Every mutation writes to the audit log, and publishing tools require an explicit notify decision.
Are skills different from the MCP server?
Skills are prompt and command bundles installed into your local agent (Claude Code, etc.) that wrap the openstatus CLI. The MCP server is a remote endpoint that any MCP-compatible client can connect to. Skills are great for terminal-shaped workflows; MCP is great for chat-shaped workflows.
Do I need an API key to connect an MCP client?
No. The MCP server is an OAuth 2.1 authorization server: Claude, ChatGPT, Cursor, and other clients open a consent screen where you pick a workspace and read-only or read & write access, and tokens are issued and refreshed automatically. The `x-openstatus-key` header still works for CI and headless agents, with the same key the CLI, API, and Terraform use.
Can the assistant accidentally notify subscribers?
No. Every publishing tool requires the assistant to set notify: true | false explicitly — there's no default. Metadata-only edits like update_status_report can't notify at all. Every call lands in the audit log under actor_type = 'mcp', so you can see exactly what happened.
---
---
title: "Terraform"
date: Apr 29, 2026
author: "Maximilian Kaske"
description: "Manage monitors, notifications, and status pages as HCL — same plan-and-apply lifecycle as the rest of your infrastructure, with one command to bootstrap from an existing workspace."
category: "Product"
---
The [openstatus Terraform provider](https://registry.terraform.io/providers/openstatusHQ/openstatus/latest) treats monitoring as code: monitors, notifications, and status pages live in the same plan-and-apply lifecycle as the rest of your infrastructure.
## Quickstart
```hcl
terraform {
required_providers {
openstatus = {
source = "openstatusHQ/openstatus"
}
}
}
resource "openstatus_monitor" "api" {
name = "API"
url = "https://api.example.com/health"
frequency = "1m"
regions = ["iad", "ams", "syd"]
}
```
```bash
export OPENSTATUS_API_TOKEN=os_xxxxxxxxxxxxxxxxxxxxxxxxxxxxxxxx
terraform init
terraform plan
terraform apply
```
## What you can do
- Manage every primary entity — monitors, notification channels, status pages, subscribers, maintenance windows — through HCL.
- Roll changes out alongside the rest of your infrastructure (Vercel projects, DNS records, secrets).
- Bootstrap an HCL file from your existing workspace with `openstatus terraform generate` — no hand-writing required.
- Code-review monitor changes in the same PR that adds the service being monitored.
## Bootstrap from an existing workspace
If you already have monitors and status pages in the dashboard, the CLI generates HCL for you:
```bash
openstatus terraform generate
```
The output is a valid HCL configuration with cross-references between resources and `import` blocks pre-wired so `terraform plan` shows zero drift on first run.
## Auth & audit
Set `OPENSTATUS_API_TOKEN` before running Terraform. The token is the same one the CLI, API, and MCP server share — generate it from **Settings > API Tokens**.
Every mutation through the provider lands in the audit log under `actor_type = 'api'`, so you can trace any change back to a key, a user, and a transport.
## Other surfaces
- Prefer a YAML config in your repo? See the [CLI](/tooling/cli) and `openstatus monitors apply`.
- Building an in-app integration? Call the [API](/tooling/api) directly.
- Want Claude or ChatGPT to read or update status reports? See the [MCP server](/tooling/mcp-server).
## Reference
Full resource list and schema in the [Terraform reference](https://www.openstatus.dev/docs/reference/terraform/).
## Frequently asked questions
How does the Terraform provider compare to the CLI?
The Terraform provider is the right choice if monitoring is part of a larger HCL-managed infrastructure. The CLI's YAML config is lighter to adopt and ships with openstatus terraform generate to bootstrap an HCL file from your existing workspace if you want to migrate.
What resources does the provider expose?
Monitors, notification channels, status pages, status page subscribers, and maintenance windows — every primary entity in the dashboard. See the Terraform reference for the full list and schema.
How do I migrate an existing workspace into Terraform?
Run openstatus terraform generate from the CLI. It fetches your full configuration and produces valid HCL with cross-references and import blocks — no hand-writing required.
Where do I get an API token?
Generate one from Settings > API Tokens, then set `OPENSTATUS_API_TOKEN` before running terraform plan. The same token works across the CLI, API, and MCP server.
---
---
title: "About openstatus"
date: Nov 10, 2025
author: "openstatus"
description: "Openstatus is built by Thibault and Max — a bootstrapped, profitable two-person team building the open-source status page for teams who ship transparency."
category: "company"
---

[BlueSky](https://bsky.app/profile/thibaultleouay.dev) | [LinkedIn](https://www.linkedin.com/in/thibault-le-ouay-ducasse/) | [GitHub](https://github.com/thibaultleouay/)

[X](https://x.com/mxkaske) | [LinkedIn](https://www.linkedin.com/in/mxkaske/) | [GitHub](https://github.com/mxkaske/)
## Our story
We met on Twitter in 2023 and started building openstatus together. What began as an **open-source** side project driven by curiosity grew into a real business with real impact.
Along the way, we've learned that **boring, reliable tech** beats chasing trends every time. We're committed to building openstatus for the long term.
## Built to last, not to flip
We're **profitable and self-funded**. No VC pressure, no growth-at-all-costs. This matters for you because:
- **We build for customers, not investors.** Every feature ships because it solves a real problem, not because it looks good on a pitch deck.
- **We're not going anywhere.** When your SOC 2 audit comes around next year, we'll still be here. And the year after that.
- **We stay lean and fast.** Two people, no bureaucracy. You can talk to the people who write the code.
## Our mission
We're building the best open-source status page — connecting monitoring, incident communication, and compliance into a single platform. **Transparent by default**, for teams who believe their users deserve to know what's happening.
## Frequently asked questions
What is openstatus?
Openstatus is an open-source status page and uptime monitoring platform founded in 2023 by Thibault Le Ouay Ducasse and Maximilian Kaske. It monitors websites, APIs, and services from 28 regions globally across multiple cloud providers. Openstatus is bootstrapped, profitable, and available both as a managed SaaS and for self-hosting.
Why is openstatus bootstrapped?
We're self-funded because it keeps us aligned with our customers, not investors. No VC pressure means we build features that matter to you, not features that look good on a pitch deck. We'll be here when your next SOC 2 audit comes around.
---
---
title: "Contact"
date: Aug 22, 2026
author: "openstatus"
description: "How to reach openstatus — support email, Discord, GitHub, a call with the founders, security disclosures, and our postal address."
category: "company"
---
Openstatus is built by a two-person team, so whoever answers you also wrote the
code. There is no ticket queue and no support tier — pick whichever channel
fits the question.
## Support
- **Email** — [ping@openstatus.dev](mailto:ping@openstatus.dev). Best for
account, billing, and plan questions. We answer within one business day.
- **Discord** — [join the community](https://www.openstatus.dev/discord) for
setup questions, monitor configuration, and quick answers from other users.
- **GitHub** — [openstatushq/openstatus](https://github.com/openstatushq/openstatus/issues)
for bug reports and feature requests. Openstatus is open source, so the issue
you file is the issue we work from.
- **Call** — [book 30 minutes](https://cal.com/team/openstatus/30min) with the
founders for onboarding, migrations from another status page, or an
architecture review before you roll out monitoring.
## Sales and enterprise
For volume pricing, invoicing, procurement paperwork, security questionnaires,
or a self-hosted deployment, email
[ping@openstatus.dev](mailto:ping@openstatus.dev) with the company name and what
you need. Vendor forms, SOC 2 evidence requests, and DPAs go to the same
address. See [pricing](/pricing) for the published plans and
[subprocessors](/subprocessors) for the vendors we rely on.
## Security
Report vulnerabilities to
[ping@openstatus.dev](mailto:ping@openstatus.dev) rather than in a public
issue — that is the contact published in
[/.well-known/security.txt](/.well-known/security.txt) (RFC 9116). The
disclosure policy lives on
[GitHub](https://github.com/openstatusHQ/openstatus/security/policy) and the
rest of our posture is on the [security page](/security).
## Press and partnerships
Email [ping@openstatus.dev](mailto:ping@openstatus.dev) for logos, screenshots,
quotes, or open-source partnership requests. Our story is on the
[about page](/about).
## Postal address
OpenStatus SAS
122 Rue Amelot
75011 Paris
France
## For agents
Machine-readable contact details are published as `Organization` JSON-LD on
every page of this site, in
[/.well-known/security.txt](/.well-known/security.txt), and in the
[API catalog](/.well-known/api-catalog). The support email
`ping@openstatus.dev` is the correct destination for anything that needs a
human.
---
---
title: "Pricing"
date: Nov 10, 2025
author: "Maximilian Kaske"
description: "Start free with uptime monitoring and a status page. Upgrade to Starter ($30/mo), Pro ($100/mo), or Scale ($500/mo) for more monitors, team collaboration, and advanced features. No credit card required."
category: "company"
---
| Features comparison | $30/month - Starter | $100/month - Pro | $500/month - Scale |
| --- | --- | --- | --- |
| [Status Pages](/status-page) | | | |
| Number of status pages | 1 +$20/mo./each | 5 +$20/mo./each | 10 +$20/mo./each |
| Number of components | 20 | 50 | 500 |
| Maintenance status | + | + | + |
| Toggle numbers visibility | + | + | + |
| Subscribers | + | + | + |
| Custom domain | + | + | + |
| Custom theme | | + | + |
| Locale switcher | + | + | + |
| Slack Agent | + | + | + |
| White Label | $300/mo. | $300/mo. | + |
| **Audience** | | | |
| Password Protection | + | + | + |
| Email Authentification | $100/mo. | $100/mo. | + |
| IP Restriction | $100/mo. | $100/mo. | + |
| [Monitors](/uptime-monitoring) | | | |
| Check Interval | 1m | 30s | 30s |
| Number of monitors | 20 +$15/mo./10 | 50 +$15/mo./10 | 50 +$15/mo./10 |
| Multi-region monitoring | + | + | + |
| Total regions | 28 | 28 | 28 |
| Regions per monitor | 6 | 28 | 28 |
| Data retention | 3 months | 12 months | 24 months |
| Response logs | + | + | + |
| Private locations | | + | + |
| OTel Exporter | | + | + |
| **Alerts** | | | |
| Slack, Discord, Email, Webhook | + | + | + |
| WhatsApp | + | + | + |
| SMS | + | + | + |
| PagerDuty | + | + | + |
| OpsGenie | + | + | + |
| Grafana OnCall | + | + | + |
| Number of notification channels | 10 | 20 | 20 |
| **Collaboration** | | | |
| Team members | Unlimited | Unlimited | Unlimited |
| Audit log | | + | + |
| SSO/SAML | $250/mo. | $250/mo. | $250/mo. |
## Enterprise
For teams that need more than what Scale offers — **SOC2 reports**, **SAML/SSO**, **custom regions**, **higher monitor and status page limits**, a **dedicated SLA**, custom contracts, and invoicing. We will tailor a plan to your requirements.
[Contact us](mailto:ping@openstatus.dev)
## Frequently asked questions
Do you offer a free plan?
Yes. Our free **Hobby** plan includes **one monitor**, **one status page with three components**, and a minimum check interval of **10 minutes**. No credit card required.
Do you offer refunds?
Yes. If you are not happy with openstatus, reach out at [ping@openstatus.dev](mailto:ping@openstatus.dev) within **30 days** of your payment and we will issue a full refund — no questions asked.
What billing options are available?
All paid plans are available with **monthly** or **annual** billing. Choose annual billing to get **2 months free** — Starter at **$300/year** ($25/mo), Pro at **$1,000/year** ($83/mo), and Scale at **$5,000/year** ($416/mo).
Can I switch between monthly and annual billing?
Yes. You can switch between monthly and annual billing at any time from your dashboard.
What are add-ons and how are they billed?
Add-ons are workspace-level settings like **White Label**, **Email Authentication**, **IP Restriction**, **extra status pages**, and **extra monitors**. Once enabled, they apply to your entire workspace. Add-ons are billed monthly regardless of your plan's billing cycle.
Can I upgrade or downgrade my plan?
Yes. You can upgrade or downgrade at any time from your dashboard. Changes take effect immediately, and billing is prorated.
What currencies do you support?
We support **EUR** and **USD**. Contact us at [ping@openstatus.dev](mailto:ping@openstatus.dev) or [book a call](https://openstatus.dev/cal) if you have questions about pricing in your currency.
Can I cancel my subscription at any time?
Yes. You can cancel anytime from your dashboard. Your plan stays active until the end of the current billing period, and you will not be charged again.
What happens if I exceed my plan limits?
We will never stop your monitors or status pages without notice. If you approach or exceed a limit, we will reach out to help you pick the right plan. Add-ons like extra status pages and monitor packs are billed per unit as listed in the comparison table.
Do you offer custom or enterprise plans?
Yes. If you need higher limits, custom regions, SSO, a dedicated SLA, or a custom contract, [book a call](https://openstatus.dev/cal) and we will tailor a plan to your needs.
What payment methods do you accept?
We accept all major credit and debit cards through **Stripe**. For annual plans we can also issue invoices on request — contact us at [ping@openstatus.dev](mailto:ping@openstatus.dev).
---
Go to the dashboard and get started
[Create Account](https://app.openstatus.dev)
---
---
---
title: "Privacy"
date: Apr 28, 2026
author: "openstatus"
description: "The privacy conduct for openstatus"
category: "company"
---
Welcome to [openstatus.dev](/) (the "Site"), hosted by openstatus ("openstatus",
"we", "us", and/or "our"). openstatus provides an open-source synthetic
monitoring platform that lets users monitor websites and APIs and receive
notifications when they are down or slow (the "Services"). We value your
privacy and are dedicated to protecting your personal data. This Privacy Policy
covers how we collect, handle, store, and disclose personal data on our
Platform.
If you have any questions, comments, or concerns regarding this Privacy Policy,
our data practices, or would like to exercise your rights, do not hesitate to
contact us at privacy@openstatus.dev.
## To Whom Does This Policy Apply
This Privacy Policy applies to customers and site visitors. Each customer is
responsible for posting its own terms, conditions, and privacy policies, and
ensuring compliance with all applicable laws and regulations.
## Changes To This Privacy Policy
This Privacy Policy may change from time to time, as our Platform and our
business may change. Your continued use of the Platform after any changes to
this Privacy Policy indicates your agreement with the terms of the revised
Privacy Policy.
## What Information Do We Collect
We collect the following categories of information:
- **Account information** you provide when signing up or updating your profile:
name, email address, profile photo, and authentication identifiers from the
identity provider you choose (e.g. GitHub or Google OAuth subject IDs).
- **Workspace and billing information**: workspace name, billing address, tax
identifiers, and payment metadata returned by our payment processor (Stripe).
We do not store full card numbers ourselves.
- **Configuration data** you submit to operate the Services: monitor URLs,
request headers, request bodies, assertions, status page configurations,
notification channel destinations (email addresses, Slack/Discord/Microsoft
Teams webhook URLs and bot tokens, OpsGenie/PagerDuty integration keys,
SMS phone numbers), and incident notes.
- **Third-party integration credentials and identifiers** that you choose to
connect — for example, Slack workspace IDs, channel IDs, bot tokens, and
user IDs returned during the OAuth install. We use these solely to deliver
the integration's features (e.g. posting status updates to a Slack channel).
- **Monitoring results and telemetry generated by the Services**: HTTP status
codes, response timings, response headers and bodies (when you opt in),
TCP/DNS check results, and trace data from the regions you select.
- **Usage and device information**: log data such as IP address, browser type,
pages viewed, referring URL, and timestamps. We use privacy-friendly analytics
tools and do not use third-party advertising cookies.
- **Communications** you send us, such as support requests and feedback.
We collect this information directly from you when you provide it on the Site,
automatically when you use the Services, and from integration providers when
you authorize them (e.g. Slack returns workspace and user identifiers during
the OAuth flow).
## What We Use Your Information For
We use your information to:
- Provide, operate, and secure the Services, including running monitoring
checks and delivering notifications you have configured.
- Authenticate you and manage your workspace, billing, and subscriptions.
- Communicate with you about your account, service updates, and support
requests.
- Improve the Platform, debug issues, and prevent abuse.
- Comply with legal obligations.
We do not sell your personal data, and we do not use it for third-party
advertising.
## How We Share Your Information
We share personal data only with the sub-processors required to operate the
Services, including our hosting and database providers, our payment processor
(Stripe), our transactional email provider, our error-monitoring provider, and
the third-party notification platforms you explicitly connect (such as Slack,
Discord, Microsoft Teams, OpsGenie, PagerDuty, or SMS gateways). We may also
disclose information when required by law.
## Data Retention
We retain personal data only for as long as is necessary for the purposes set
out in this Privacy Policy:
- **Account and workspace data** is retained for as long as your account
remains active. If you delete your account or workspace, we delete or
anonymize the associated personal data within 30 days, except where we are
required to retain it for legal, accounting, or fraud-prevention purposes.
- **Billing records** are retained for the period required by applicable tax
and accounting law (typically up to 7 years).
- **Monitoring results and telemetry** are retained according to the data
retention window of your subscription plan, after which they are deleted or
aggregated.
- **Application logs** containing IP addresses and request metadata are
retained for up to 30 days for security and debugging purposes.
- **Third-party integration tokens** (e.g. Slack bot tokens) are retained
until you uninstall the integration or delete the workspace, after which
they are deleted within 30 days.
When you uninstall the Slack app — either from the Slack workspace or from
within openstatus — we revoke the OAuth grant and delete the associated bot
token, workspace ID, and channel mappings within 30 days.
## Your Rights
Depending on your jurisdiction (including under the GDPR, UK GDPR, and CCPA),
you may have the following rights regarding your personal data:
- **Right of access** — request a copy of the personal data we hold about you.
- **Right to rectification** — ask us to correct inaccurate or incomplete
information.
- **Right to erasure ("right to be forgotten")** — request that we delete your
personal data.
- **Right to restrict or object to processing** — ask us to limit how we use
your data.
- **Right to data portability** — receive your data in a structured,
machine-readable format.
- **Right to withdraw consent** — where processing is based on consent, you
may withdraw it at any time.
- **Right to lodge a complaint** with your local data protection authority.
You can exercise most of these rights directly from your account settings —
you can edit or delete your profile, export your workspace data, and delete
your workspace from the dashboard. To make any other request, or if you need
help, email us at privacy@openstatus.dev. We will respond within 30 days. We
may need to verify your identity before fulfilling the request, and we will
not charge a fee unless the request is manifestly unfounded or excessive.
## How To Contact Us
For privacy-related questions or to exercise any of the rights above, please
contact us at privacy@openstatus.dev.
---
For how we protect data across these providers, see our [security page](/security).
---
---
title: "Component Registry"
date: Feb 08, 2026
author: "openstatus"
description: "Install beautiful, accessible React components for status pages. Pre-built, customizable components compatible with shadcn/ui."
category: "Documentation"
---
Build your status page in minutes, not hours. The openstatus registry provides production-ready React components specifically designed for status pages. Built on top of [shadcn/ui](https://ui.shadcn.com), these components are accessible, customizable, and battle-tested in production.
## What is the Registry?
The openstatus registry is a collection of shadcn/ui-compatible, pre-built components for common status page patterns. Instead of building status indicators, event timelines, and monitoring displays from scratch, install and customize these components directly into your project.
All components are:
- **Accessible** - Built with ARIA patterns and keyboard navigation
- **Customizable** - Fully themeable with Tailwind CSS
- **Type-safe** - Written in TypeScript with complete type definitions
- **Localizable** - Optional i18n provider for translated labels and locale-aware date formatters; English defaults out of the box
- **Production-ready** - Battle-tested in production at openstatus
## Example
Hover over the example below to see which component is being used.
> We are working on aligning component `Props` with [`@openstatus/sdk-node`](https://jsr.io/@openstatus/sdk-node) return values, enabling you to use our SDK to build your own custom status page.
View the [GitHub source code](https://github.com/openstatusHQ/openstatus/tree/main/apps/web/src/content/shadcn-registry-example.tsx) for examples and usage patterns.
## Installation
> **Prerequisites:** these components target an initialised **shadcn project on Tailwind CSS v4**. If you're starting from scratch (Astro, Vite, etc.), run `shadcn init` first — it creates `components.json`, the `@/*` path alias, and your Tailwind v4 CSS entry. Tested with the latest shadcn CLI (`shadcn@latest`).
Install any component with a single [shadcn CLI](https://ui.shadcn.com/docs/cli) command:
```bash
npx shadcn@latest add https://openstatus.dev/r/status-complete
```
Or install the registry first:
```bash
pnpm dlx shadcn@latest registry add @openstatus
```
And install the component via:
```bash
pnpm dlx shadcn@latest add @openstatus/status-complete
```
### Available Components
Components are organized by functionality:
- **Collections:** `status-complete` (everything — body + chrome), `status-essentials` (body subset), `status-chrome` (header + footer + switchers + status-updates) - Full status page bundles
- **Body Blocks:** `status-banner`, `status-bar`, `status-calendar`, `status-feed`, `status-events`, `status-component`, `status-component-group`, `status-blank`, `status-icon`, `status-layout`, `status-timestamp` - Individual components for the page body
- **Chrome Blocks:** `status-page-shell`, `status-page-header`, `status-page-footer`, `status-page-get-in-touch`, `status-updates`, `status-theme-switcher`, `status-locale-switcher` - Header, footer, and surrounding chrome for a full status page
- **i18n:** `status-i18n` - Optional context provider + hook for translated labels and locale-aware date formatters (auto-installed as a dependency of the blocks above)
Explore the full registry at [openstatus.dev/r/registry.json](https://openstatus.dev/r/registry.json)
> **Tip:** `status-complete` installs every feature and pulls extra dependencies (`next-themes`, `sonner`, `react-day-picker`, `@date-fns/utc`). If you only need the page body, `status-essentials` is the lighter entry point.
### Localization
Blocks ship with English (`en-US`) defaults and require zero setup. To localize, mount `` near your app root and pass a `StatusBlocksLabels` value (translated strings + locale-aware date formatters built from your own i18n library — `next-intl`, `react-intl`, or whatever you use). Blocks read labels via `useStatusBlocksLabels()`; if no provider is mounted, they fall back to `defaultStatusBlocksLabels`.
This contract keeps the registry library-agnostic — `@openstatus/ui` does not depend on `next-intl` or any other i18n package directly.
---
Want to customize your theme?
## Learn More
- [Source Code Example](https://github.com/openstatusHQ/openstatus/tree/main/apps/web/src/content/shadcn-registry-example.tsx) - See all components in action
- [Blog Post](/blog/shadcn-component-registry) - How We Build Our shadcn Component Registry
- [Openstatus SDK](https://jsr.io/@openstatus/sdk-node) - Build on top of openstatus with our SDK
- [shadcn/ui Documentation](https://ui.shadcn.com) - Learn about the underlying component system
- [Openstatus GitHub](https://github.com/openstatusHQ/openstatus) - Star the project and contribute
- [Theme Explorer](https://themes.openstatus.dev) - Explore community themes
## Support
If you encounter issues, have questions, or want to share feedback:
- [Open an issue](https://github.com/openstatusHQ/openstatus/issues)
- [Join our Discord](https://openstatus.dev/discord)
- [Check the documentation](https://www.openstatus.dev/docs)
- [Send an email](mailto:ping@openstatus.dev)
---
---
title: "Security"
date: May 28, 2026
author: "openstatus"
description: "How openstatus protects your data, where it lives, and how to reach us if you find something."
category: "company"
---
Security at openstatus rests on three things: open-source code, the ability to self-host, and a public list of every system we touch. This page describes how we protect data in the hosted product and how to reach us if you find something.
## Open by default
**Auditable code**
Every line of openstatus is on [GitHub](https://github.com/openstatushq/openstatus). You can read it, fork it, or open a pull request.
**Self-hostable**
Don't want your data on our infrastructure? Run openstatus on your own — the [self-hosting guide](https://www.openstatus.dev/docs/guides/self-hosting-openstatus) walks through it.
**Public sub-processors**
The full list of services we use to run openstatus.dev is public at [/subprocessors](/subprocessors) — no NDA, no trust center login.
## Data protection
All traffic to openstatus.dev and the API is served over HTTPS with modern TLS. Data is encrypted at rest by our infrastructure providers — primary databases on [Turso](https://turso.tech), analytics on [Tinybird](https://tinybird.co), application hosting on [Vercel](https://vercel.com) and [Fly](https://fly.io). The full list, with regions and purpose, is on the [sub-processors page](/subprocessors).
Application secrets — third-party tokens, webhook URLs, integration credentials — are stored as environment variables in our hosting providers, never committed to the repository. Integration credentials you submit (Slack bot tokens, OpsGenie keys, etc.) are stored encrypted in the database and stripped from audit log entries.
## Authentication and access
You sign in with GitHub or Google OAuth. We never see or store your password.
API access uses scoped keys: a key with the `read` scope can only call read-only endpoints; a key with the `write` scope can mutate data. Scopes are enforced before any database lookup, so a read-only key can't even reach a write code path.
Every workspace is isolated. Every database read and write is filtered by workspace ID at the service layer — there is no shared state between workspaces.
Every mutation in your workspace — whether it comes from the dashboard, the API, MCP, or the Slack integration — is recorded in an append-only audit log. Workspace members on **Pro** can browse it at `/settings/audit-logs` in the dashboard. If a teammate changes a monitor, deletes an integration, or rotates an API key, it's on record.
## Where your data lives
We default to EU-hosted infrastructure wherever the provider offers it: queues on [GCP](https://cloud.google.com) (EU), analytics on Tinybird (EU), email on [Resend](https://resend.com) (EU), product analytics on [Openpanel](https://openpanel.dev) (EU). Application hosting and the primary database run globally on Vercel, Fly, Koyeb, Railway and Turso.
The complete list, with purpose and region for each provider, lives at [/subprocessors](/subprocessors).
## Operational practices
Every change to openstatus goes through a pull request on GitHub. PRs are reviewed by a human and by automated code review before merge. CI runs lint, type-check, and tests on every commit.
We publish a [public changelog](/changelog) for every meaningful change to the product, so you can see what shipped and when.
Larger architectural decisions are written up as ADRs in the repo's [`/docs/adr`](https://github.com/openstatusHQ/openstatus/tree/main/docs/adr) folder, so the reasoning behind each one is on record.
## Reporting a vulnerability
If you find a security issue, email [ping@openstatus.dev](mailto:ping@openstatus.dev). We acknowledge reports within three business days and keep you informed until the issue is resolved. The full disclosure policy is in [SECURITY.md](https://github.com/openstatushq/openstatus/blob/main/SECURITY.md), and our RFC 9116 contact is at [/.well-known/security.txt](/.well-known/security.txt).
For privacy questions, see our [privacy policy](/privacy) or email the same address.
---
---
title: "Subprocessors"
date: Nov 10, 2025
author: "openstatus"
description: "The list of subprocessors for openstatus"
category: "company"
---
## List of Subprocessors
Vercel:
- Purpose: Server hosting
- Location: Global
Fly:
- Purpose: Server hosting
- Location: Global
Koyeb:
- Purpose: Server hosting
- Location: Global
Railway:
- Purpose: Server hosting
- Location: Global
GCP:
- Purpose: Queue
- Location: EU
Turso:
- Purpose: Relational database (SQLite)
- Location: Global
Tinybird:
- Purpose: Analytical database (Clickhouse)
- Location: EU
Stripe:
- Purpose: payment processing
- Location: US
Resend:
- Purpose: Email sending
- Location: EU
Openpanel:
- Purpose: Product analytics
- Location: EU
For how we protect data across these providers, see our [security page](/security).
---
---
title: "Terms of Service"
date: Nov 10, 2025
author: "openstatus"
description: "The terms and conditions for openstatus"
category: "company"
---
Subject to these Terms of Service (this "Agreement"), [openstatus.dev](/)
("OpenStatus", "we", "us" and/or "our") provides access to OpenStatus's cloud
platform as a service (collectively, the "Services"). By using or accessing the
Services, you acknowledge that you have read, understand, and agree to be bound
by this Agreement.
If you are entering into this Agreement on behalf of a company, business or
other legal entity, you represent that you have the authority to bind such
entity to this Agreement, in which case the term "you" shall refer to such
entity. If you do not have such authority, or if you do not agree with this
Agreement, you must not accept this Agreement and may not use the Services.
## 1. Acceptance of Terms
By signing up and using the services provided by OpenStatus (referred to as the
"Service"), you are agreeing to be bound by the following terms and conditions
("Terms of Service"). The Service is owned and operated by OpenStatus ("Us",
"We", or "Our").
## 2. Description of Service
OpenStatus provides an open source monitoring and status page tool. ("the
Product"). The Product is accessible at openstatus.dev and other domains and
subdomains controlled by Us (collectively, "the Website").
## 3. Fair Use
You are responsible for your use of the Service and for any content that you
post or transmit through the Service. You may not use the Service for any
purpose that is illegal or infringes upon the rights of others.
We reserve the right to suspend or terminate your access to the Service if we
determine, in our sole discretion, that you have violated these Terms of
Service, including but not limited to, adding phishing links, spam links, scam
links, or other inappropriate or illegal content.
## 4. Intellectual Property Rights
You acknowledge and agree that the Service and its entire contents, features,
and functionality, including but not limited to all information, software, code,
text, displays, graphics, photographs, video, audio, design, presentation,
selection, and arrangement, are owned by Us, our licensors, or other providers
of such material and are protected by United States and international copyright,
trademark, patent, trade secret, and other intellectual property or proprietary
rights laws.
## 5. Changes to these Terms
We reserve the right to revise and update these Terms of Service from time to
time in our sole discretion. All changes are effective immediately when we post
them, and apply to all access to and use of the Website thereafter. Your
continued use of the Website following the posting of revised Terms of Service
means that you accept and agree to the changes.
## 6. Contact Information
Questions or comments about the Website or these Terms of Service may be
directed to our support team at support@openstatus.dev.
## 7. Disclaimer of Warranties
THE SERVICE AND ITS CONTENT ARE PROVIDED ON AN "AS IS" AND "AS AVAILABLE" BASIS
WITHOUT ANY WARRANTIES OF ANY KIND. WE DISCLAIM ALL WARRANTIES, INCLUDING, BUT
NOT LIMITED TO, THE WARRANTY OF TITLE, MERCHANTABILITY, NON-INFRINGEMENT OF
THIRD PARTIES’ RIGHTS, AND FITNESS FOR PARTICULAR PURPOSE.
## 8. Limitation of Liability
IN NO EVENT WILL WE, OUR AFFILIATES OR THEIR LICENSORS, SERVICE PROVIDERS,
EMPLOYEES, AGENTS, OFFICERS OR DIRECTORS BE LIABLE FOR DAMAGES OF ANY KIND,
UNDER ANY LEGAL THEORY, ARISING OUT OF OR IN CONNECTION WITH YOUR USE, OR
INABILITY TO USE, THE WEBSITE, THE SERVICE, ANY WEBSITES LINKED TO IT, ANY
CONTENT ON THE WEBSITE OR SUCH OTHER WEBSITES, INCLUDING ANY DIRECT, INDIRECT,
SPECIAL, INCIDENTAL, CONSEQUENTIAL, OR PUNITIVE DAMAGES.
## 9. Governing Law and Jurisdiction
These Terms of Service and any dispute or claim arising out of or related to
them, their subject matter or their formation (in each case, including
non-contractual disputes or claims) shall be governed by and construed in
accordance with the internal laws of France without giving effect to any choice
or conflict of law provision or rule. Any legal suit, action, or proceeding
arising out of, or related to, these Terms of Service or the Website shall be
instituted exclusively in the federal courts of France.
---
By using OpenStatus , you acknowledge that you have read these Terms of Service,
understood them, and agree to be bound by them. If you do not agree to these
Terms of Service, you are not authorized to use the Service. We reserve the
right to change these Terms of Service at any time, so please review them
frequently.
Thank you for using OpenStatus!