Ship your status page before your SOC 2 auditor asks for it
The status page trusted by growing teams. Communicate incidents, prove compliance readiness, and monitor uptime from 28 global regions.
Free to start. Paid plans from $30/mo.
Trusted by teams who ship transparency
The status page that closes enterprise deals
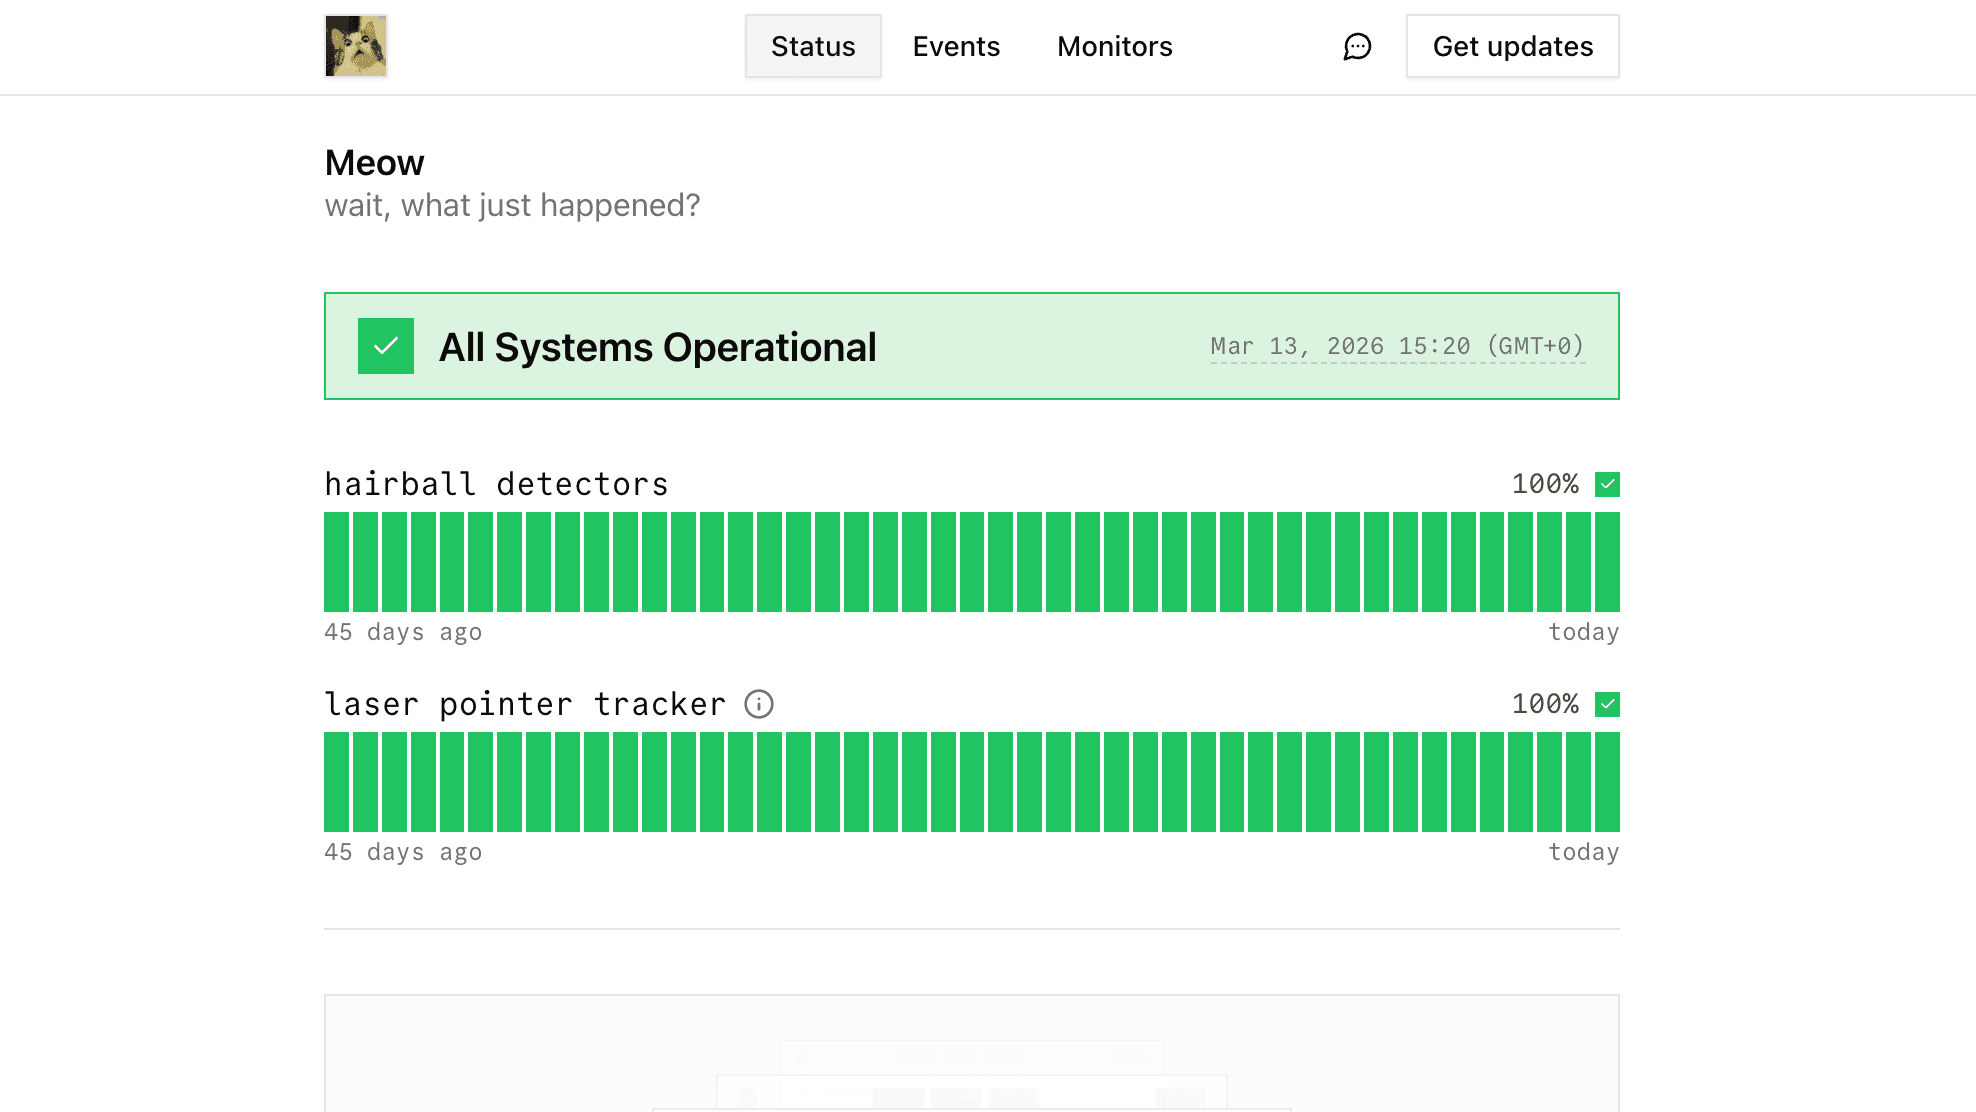
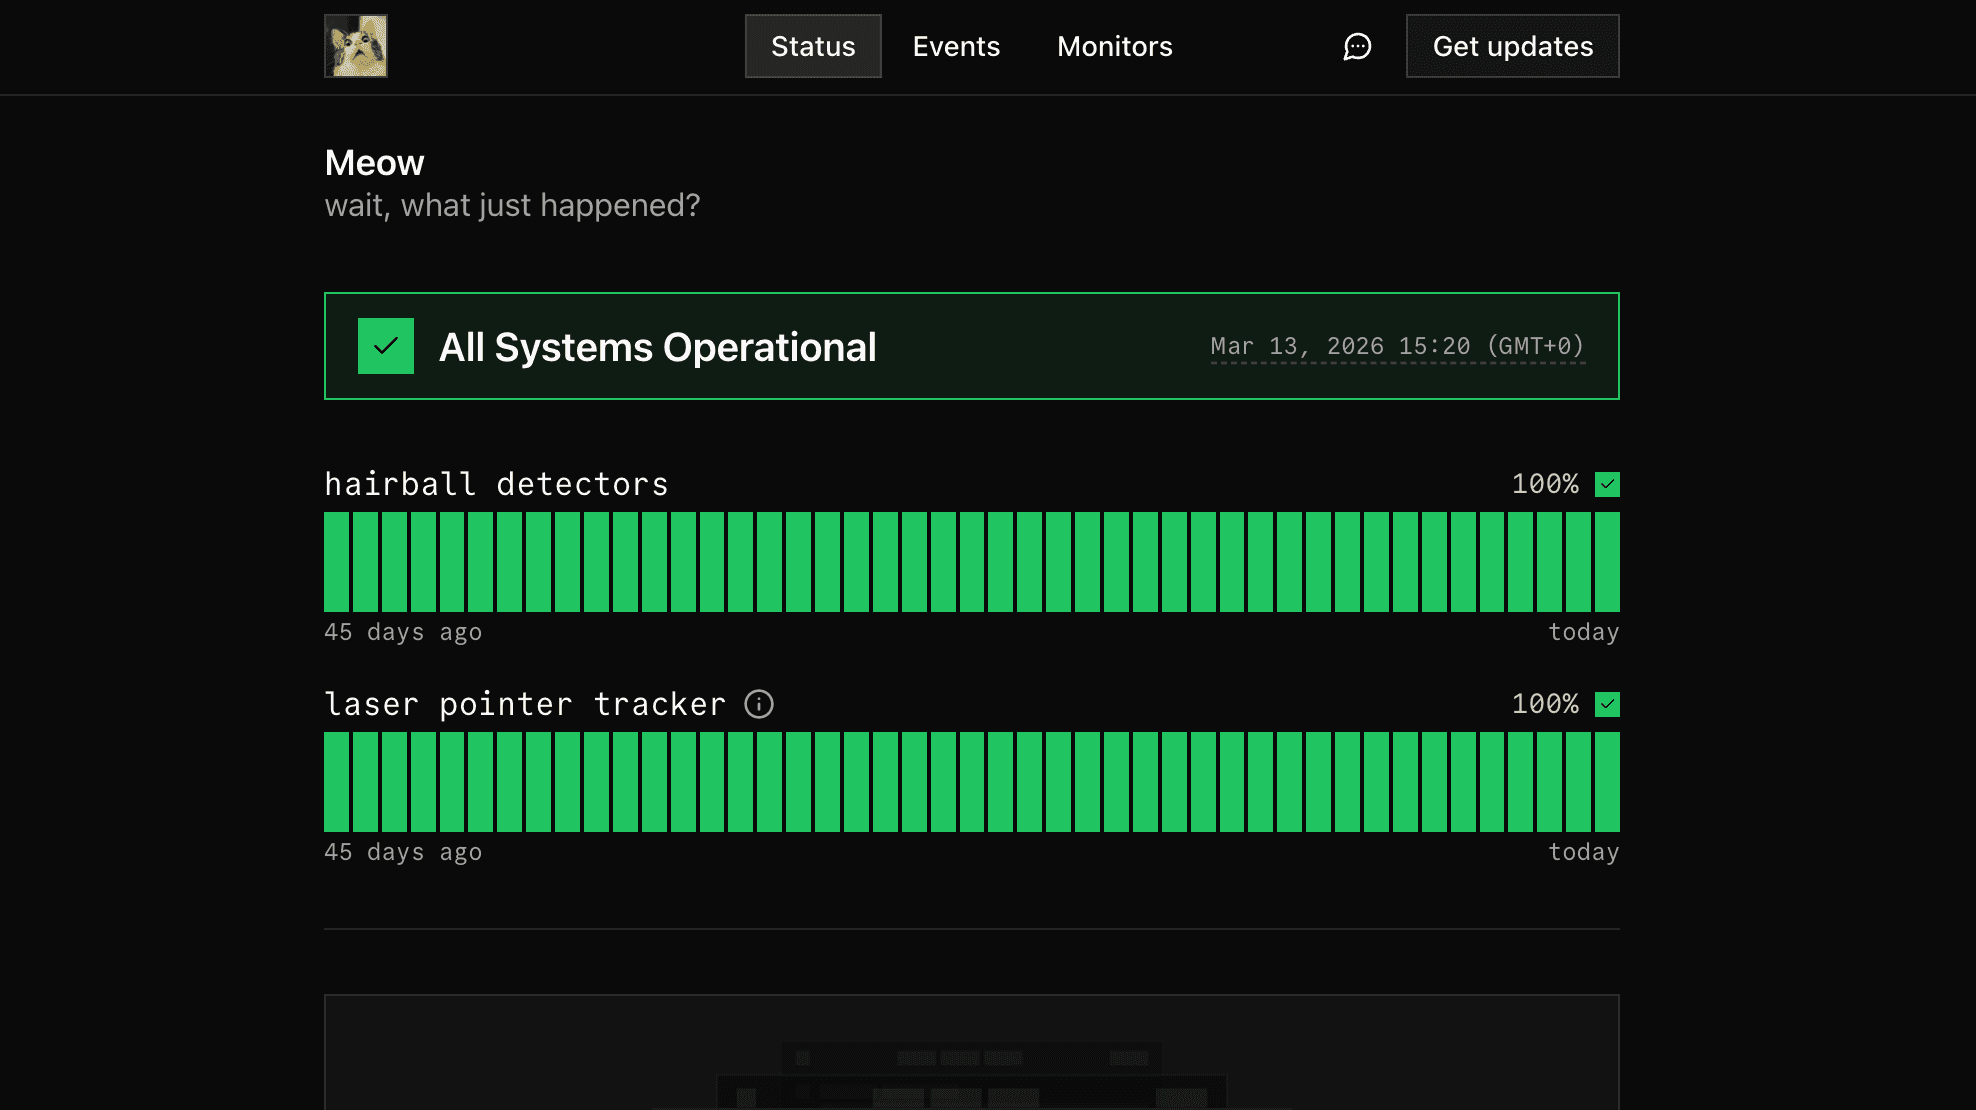
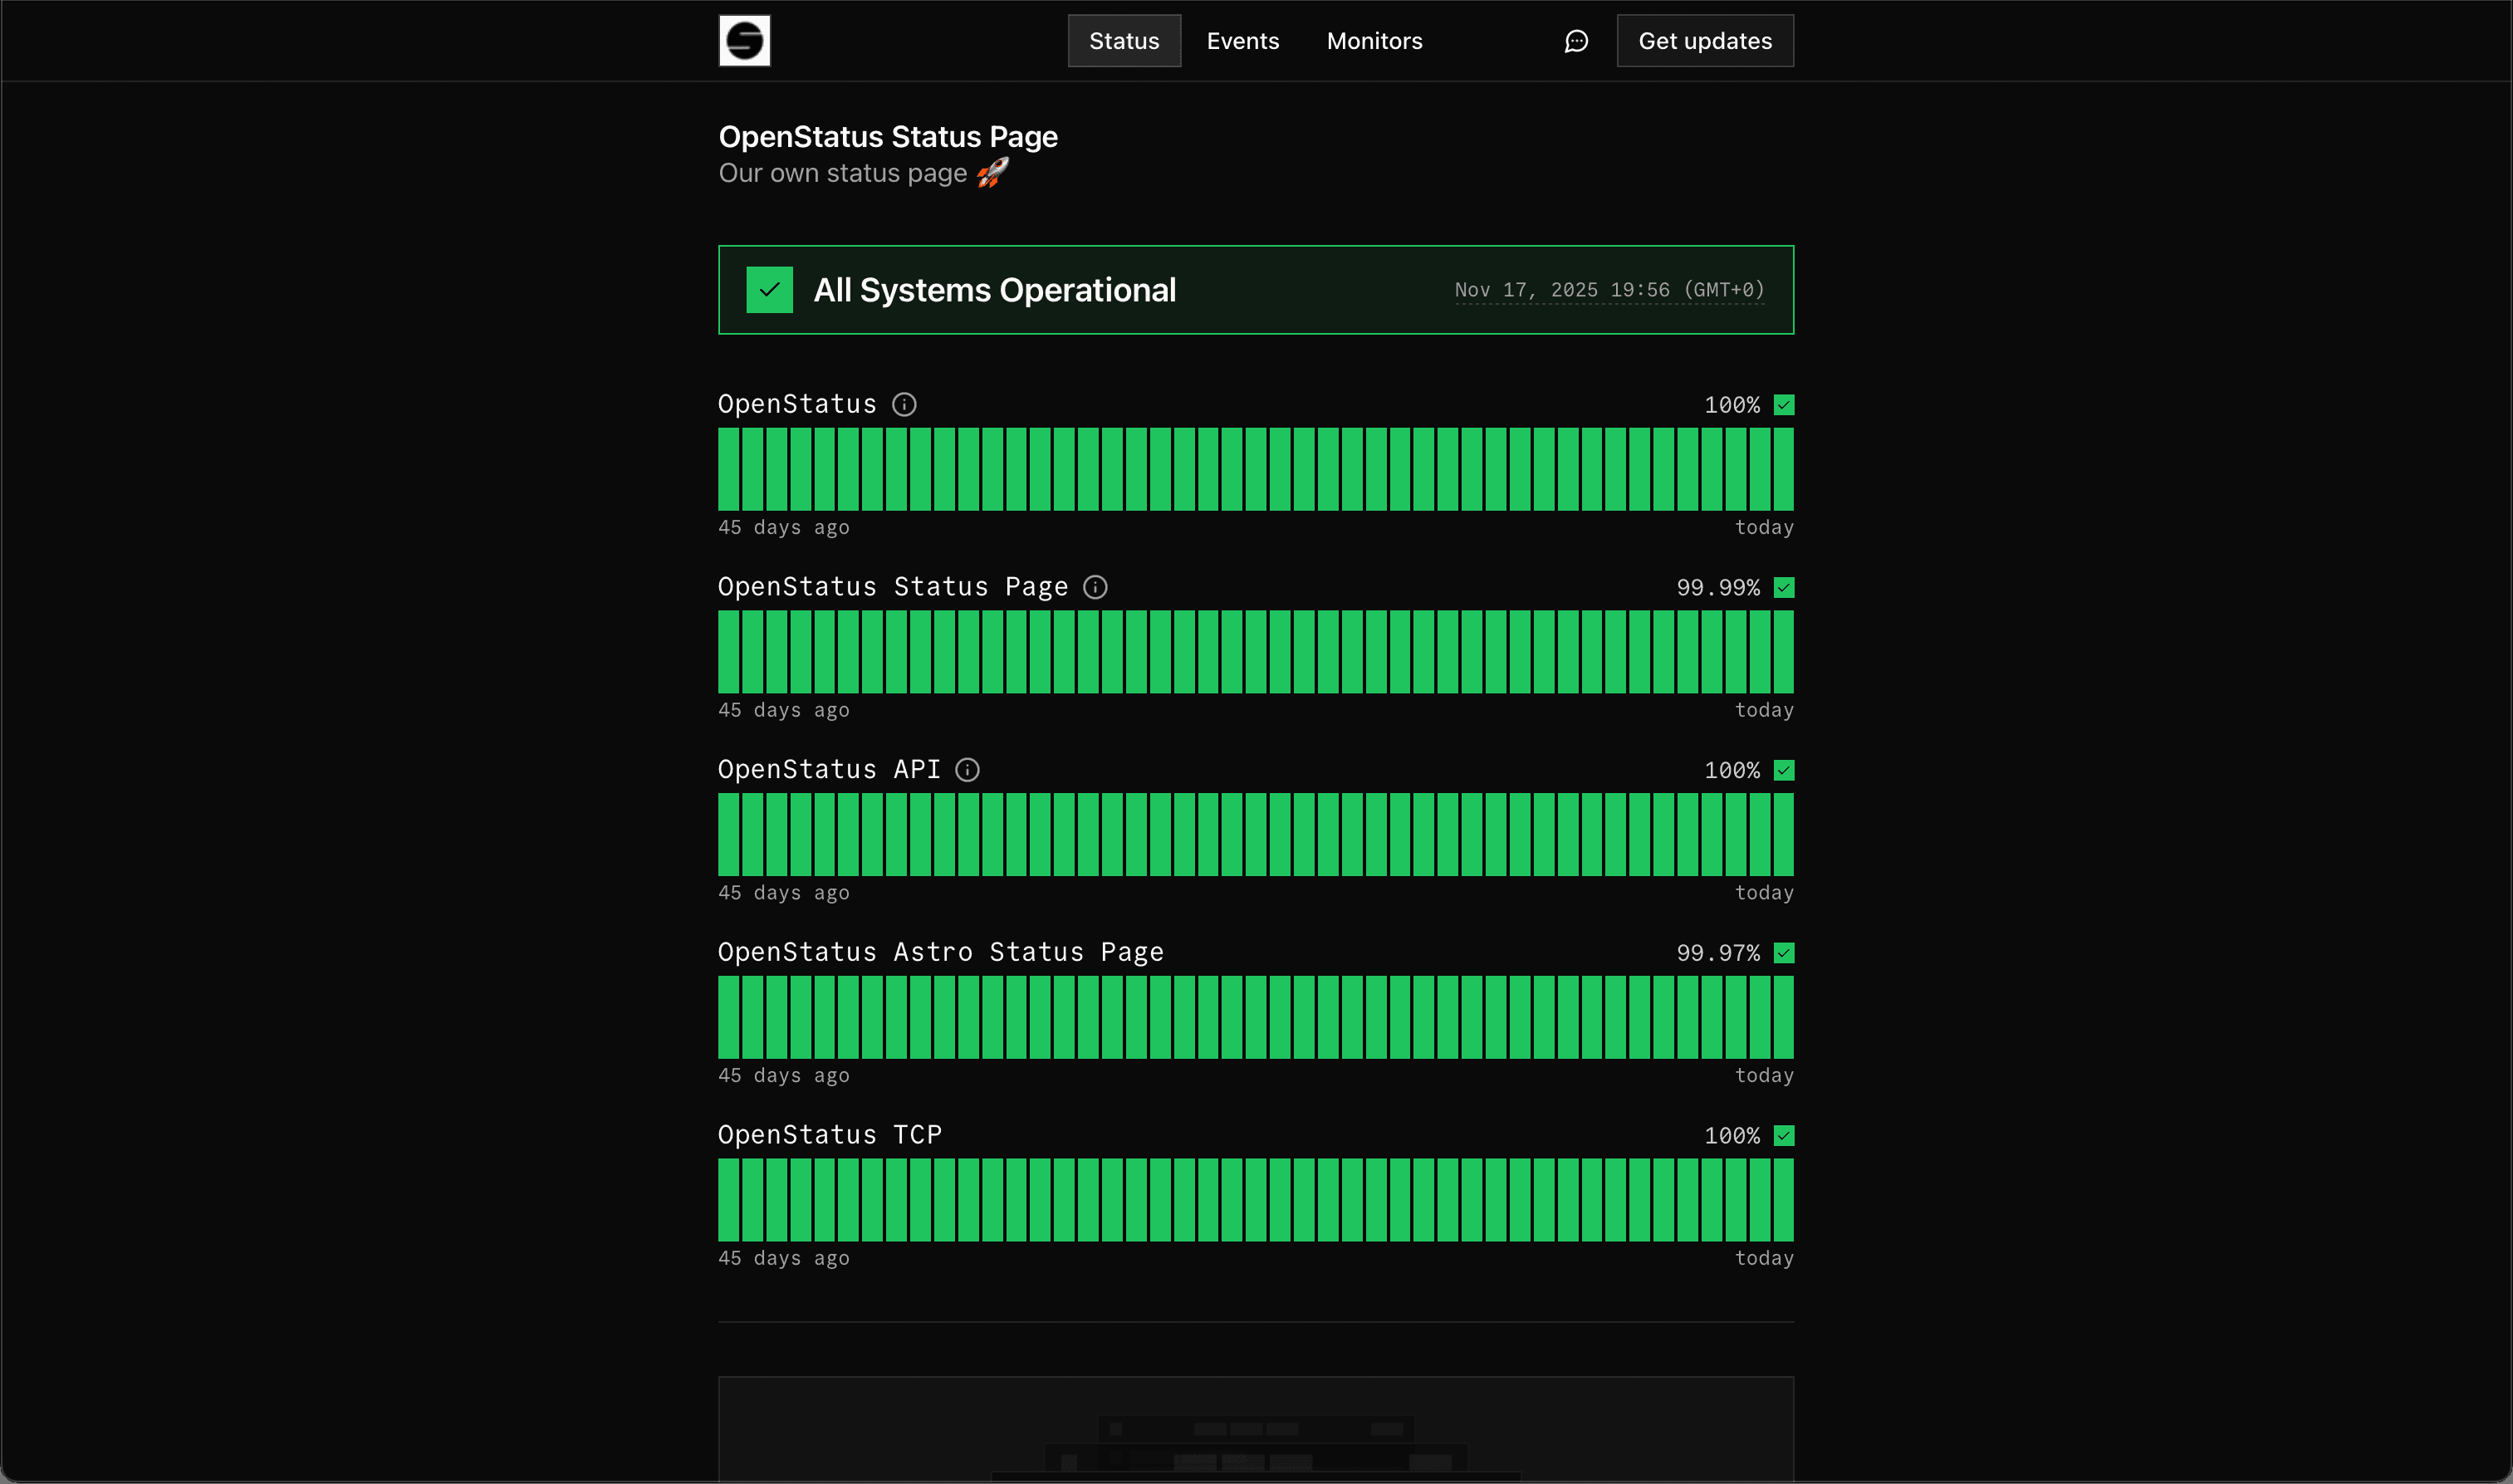
A status page helps you communicate incidents more effectively. It adds transparency, so users aren't left guessing. It enables proactive communication, giving updates without users needing to ask. And it shows reliability, not just in uptime but in how you handle downtime and keep people informed.
Make it yours with themes from our Theme Store, custom domains, and branding. Share publicly or password protect for internal teams. Keep everyone in the loop with status reports, maintenance windows, and subscriptions.
- Customization with our Theme Store
- Public or password protected pages
- Custom domains
- Status reports and maintenance windows
- Subscription channels: email, RSS/Atom, SSH
Read more about status pages.
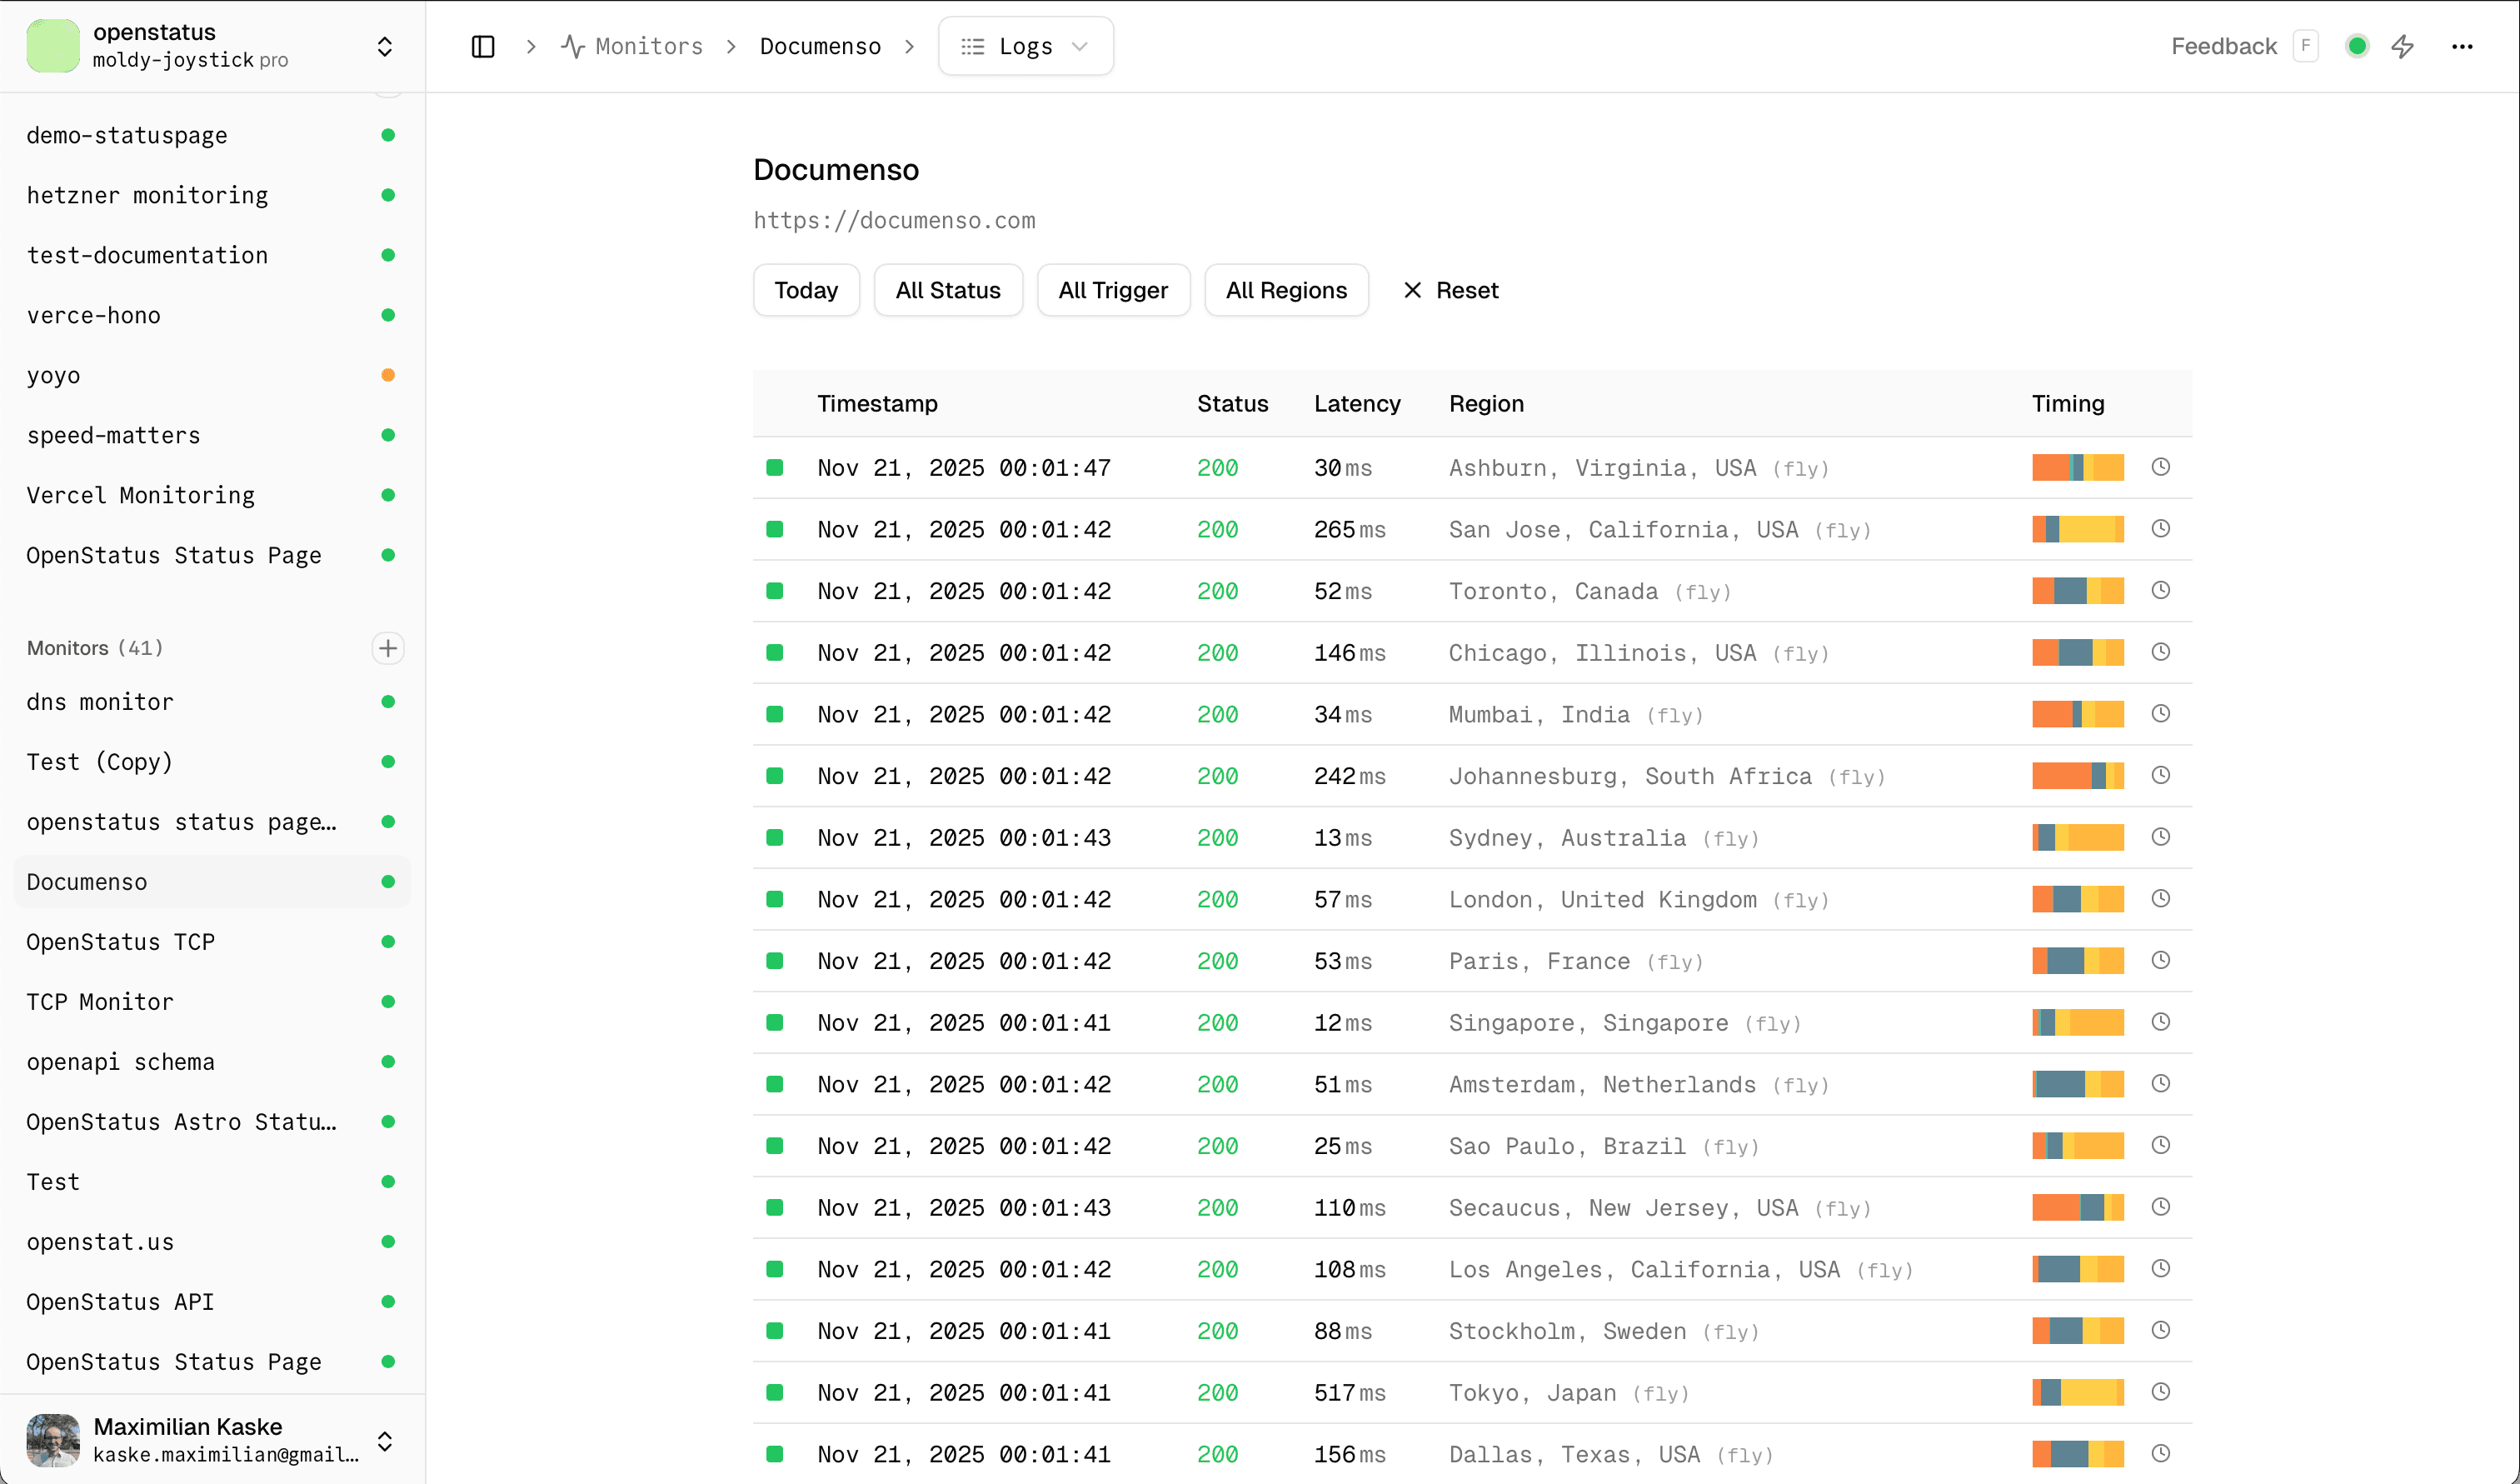
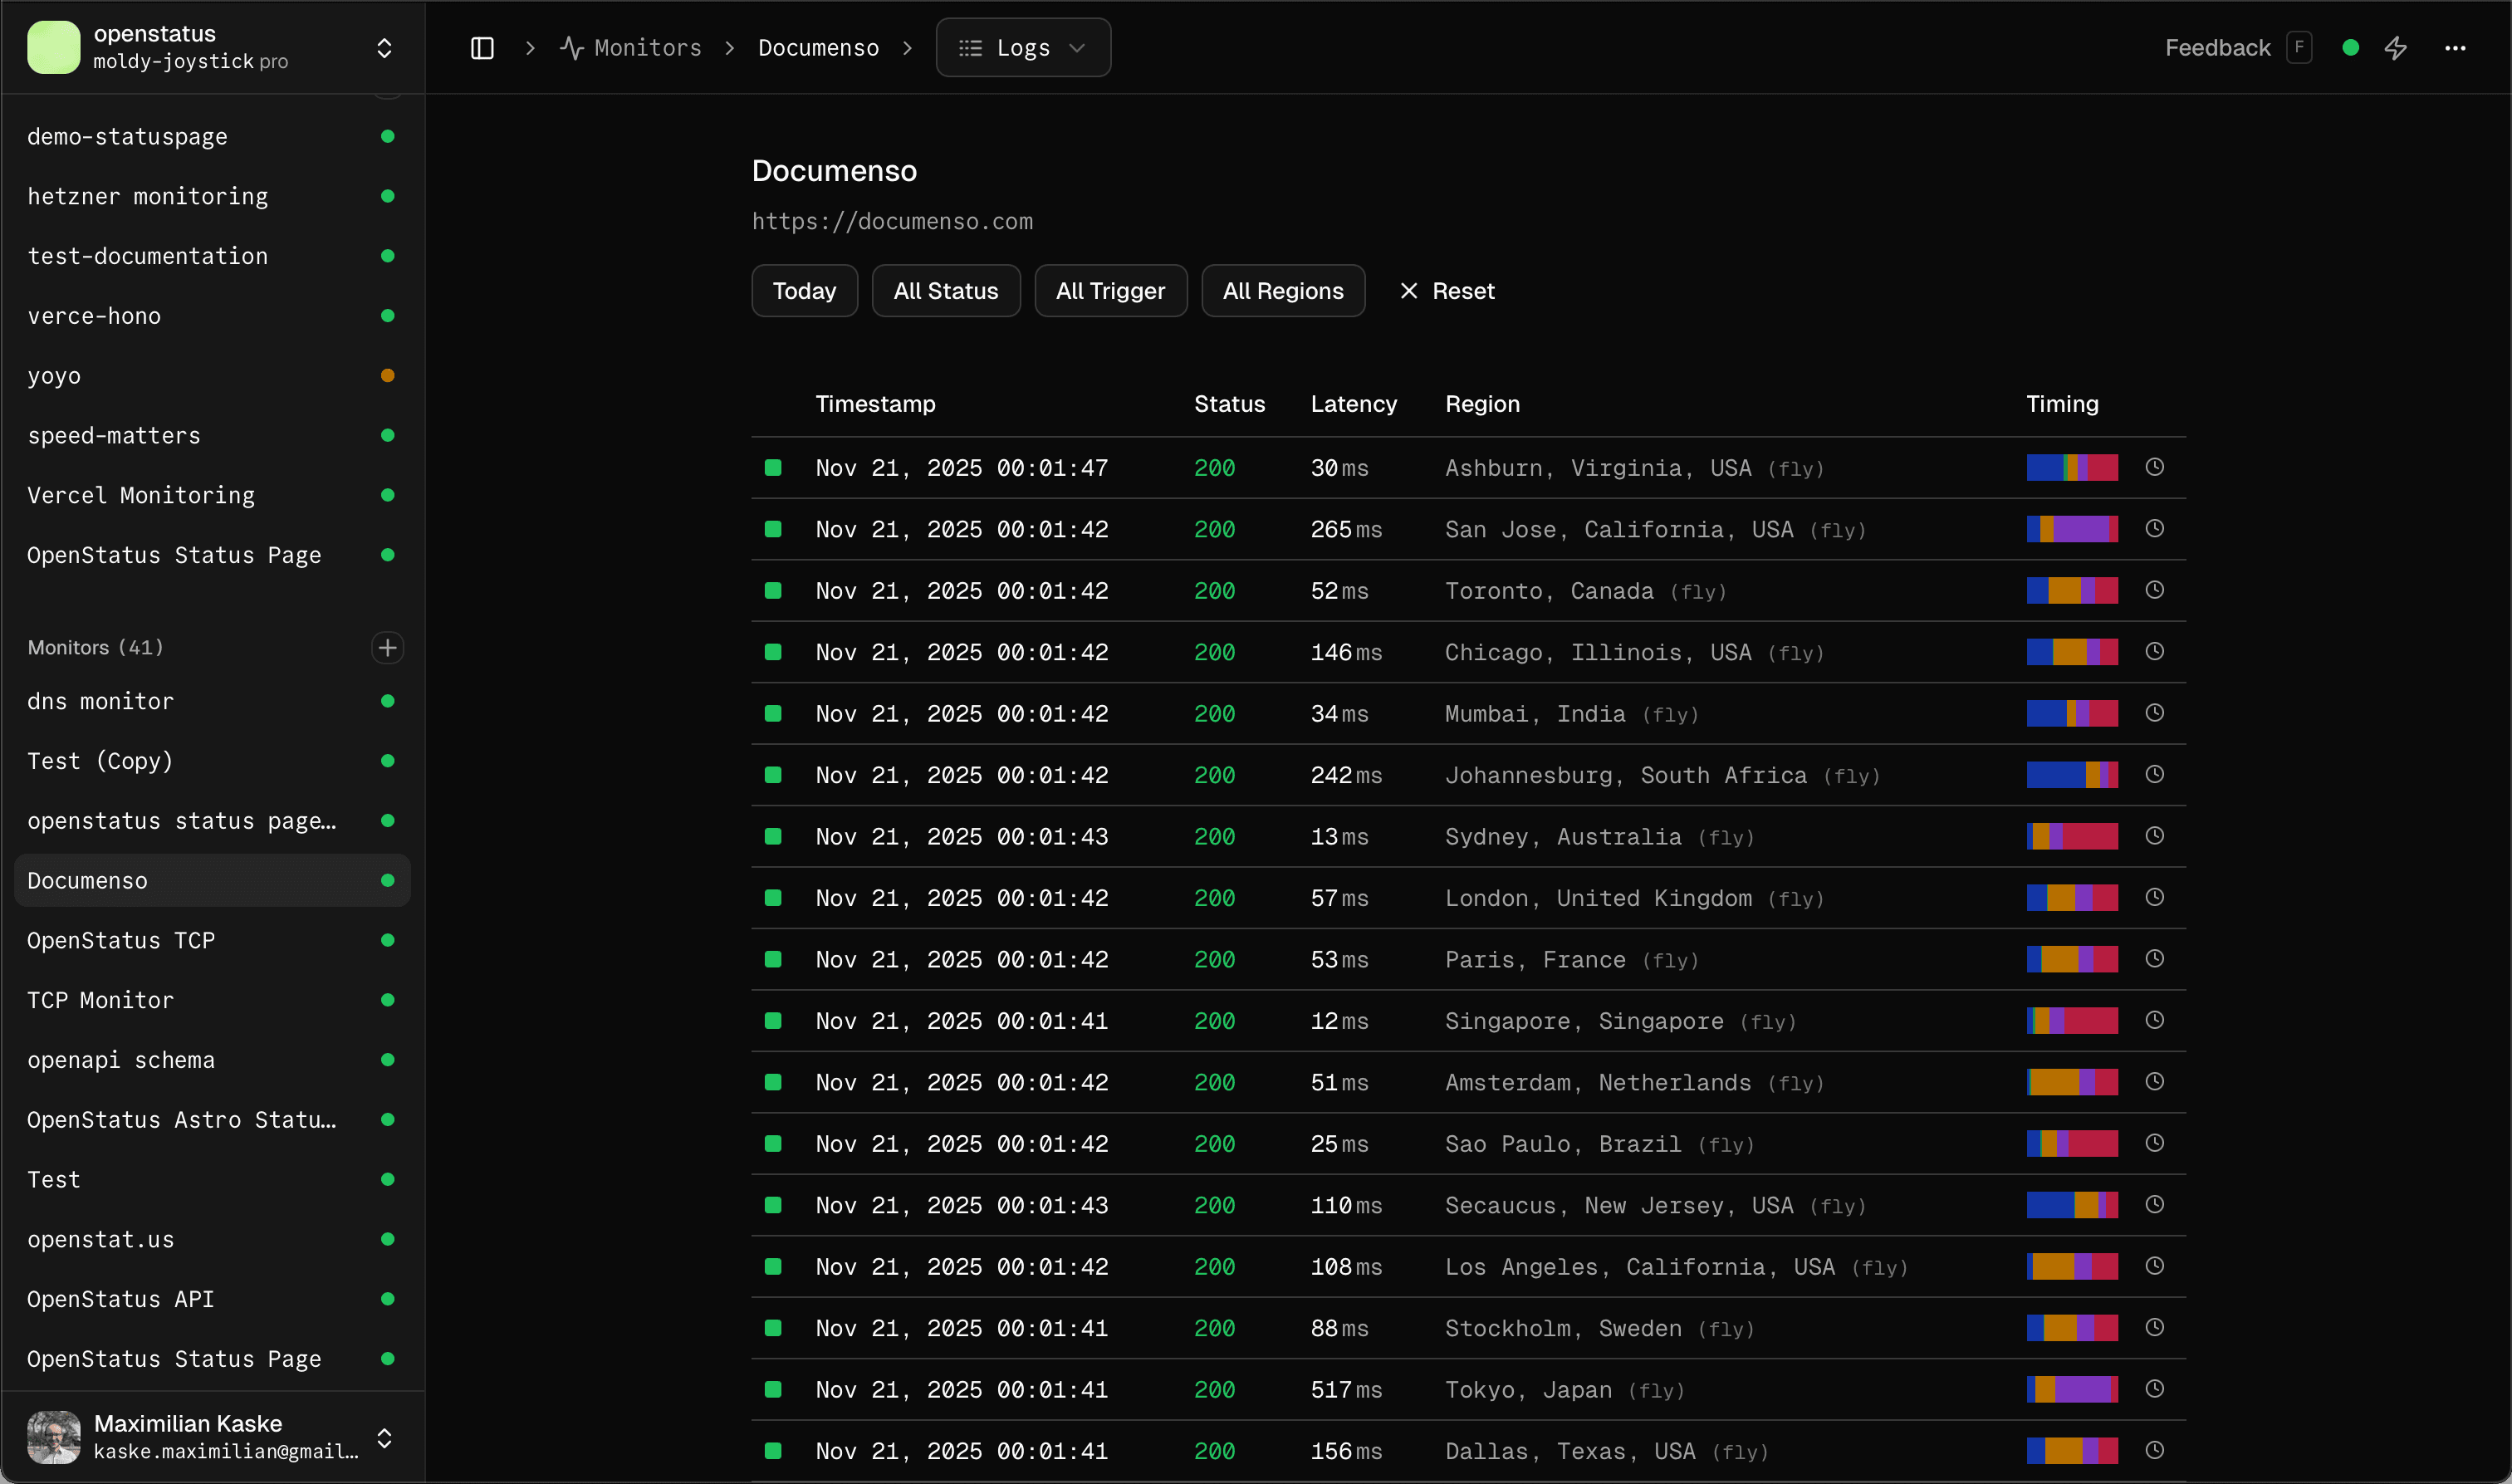
Monitor from 28 regions — know before your customers do
Monitor your endpoints from 28 regions across multiple clouds. Get alerted on Slack, Discord, PagerDuty, or email the moment something breaks. Your status page updates automatically — no manual work during incidents.
- 28 regions, 3 cloud providers — no blind spots
- Monitor any HTTP endpoint, REST or GraphQL
- Version your monitors with YAML and CI/CD
- Monitor behind firewalls with a single Docker container
- Alerts on Slack, Discord, PagerDuty, email, webhooks, ...
Read more about uptime monitoring.
Managing openstatus — for humans and agents
Every action in the dashboard is reachable programmatically. One API key, four ways in:
- CLI — manage from your terminal
- API — typed HTTP endpoints with an OpenAPI spec
- MCP server — let Claude, ChatGPT, or Cursor run your monitoring
- Terraform provider — version monitors as HCL
Read more about our tooling.
Check your website's latency
Global Speed Checker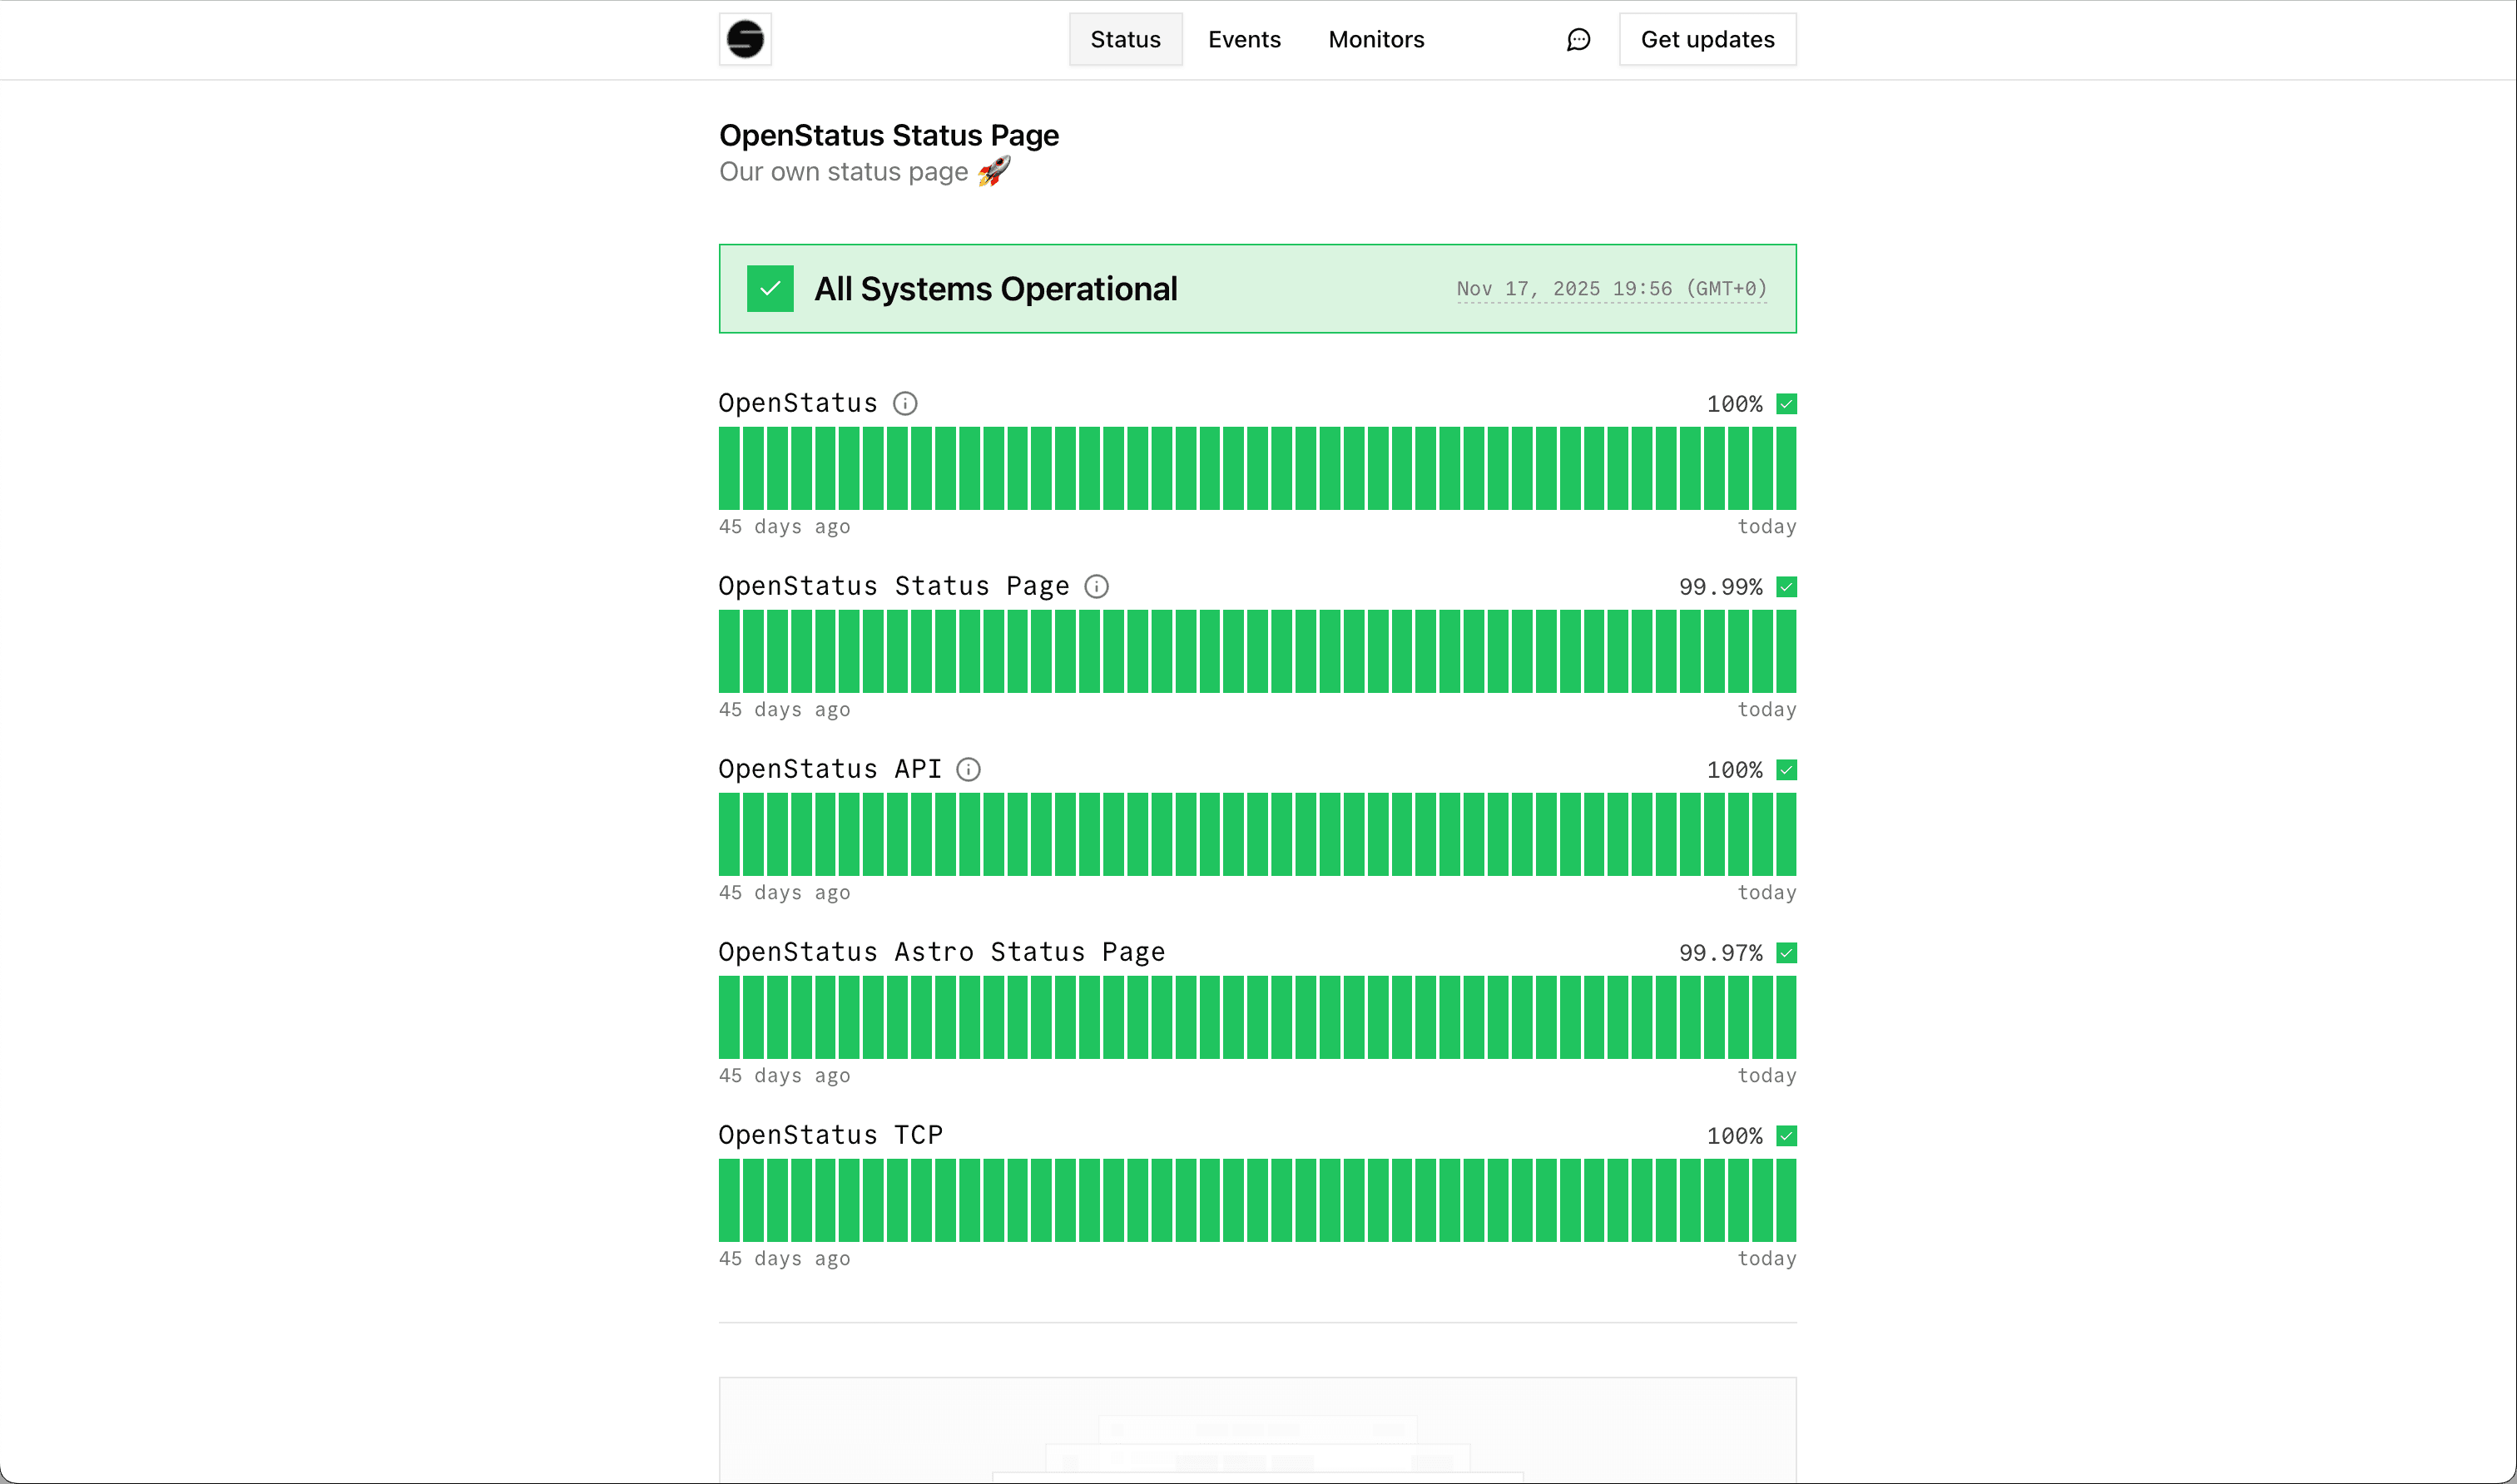
Frequently asked questions
What is openstatus?
Openstatus gives you a branded status page and uptime monitoring that's audit-ready out of the box. Set up status.yourcompany.com, connect your monitors, and start communicating incidents — in minutes.
It's open-source, self-hostable, and used by teams like Cal.com, WhiteBIT, and Documenso. Available as a managed SaaS or for self-hosting.
Do I need a status page for SOC 2?
SOC 2's CC2.3 criteria requires you to demonstrate incident communication with external parties — but it doesn't prescribe a specific tool. That said, a status page is the fastest, most auditor-friendly way to satisfy that requirement.
Every status report on openstatus is timestamped and documented automatically, giving you an audit-ready trail of how you communicated during incidents. Most teams set it up in under 2 minutes.
How does openstatus help with SOC 2 compliance?
Openstatus gives you everything an auditor needs to verify your incident communication process:
- Branded status page with custom domain
- Incident history with timestamped status reports
- Subscriber notifications so stakeholders are proactively informed
- Maintenance windows for planned changes
- Password protection for internal or client-specific pages
You can be SOC 2-ready in minutes, not weeks.
What does the free plan include?
The free plan includes one monitor, one status page (with three page components), and a minimum check interval of 10m. Check the pricing table for a full comparison.
No credit card required — upgrade or cancel at any time.
Who is behind openstatus?
Openstatus is built by Thibault and Max — a bootstrapped two-person team building in public.
We're profitable and self-funded — we'll be here when your next audit comes around.
Read more on our about page.

What regions does openstatus monitor from?
Openstatus monitors from 28 regions worldwide across all continents:
Europe
Amsterdam 🇳🇱 | Stockholm 🇸🇪 | Paris 🇫🇷 | Frankfurt 🇩🇪 | London 🇬🇧
North America
Dallas 🇺🇸 | New Jersey 🇺🇸 | Los Angeles 🇺🇸 | San Jose 🇺🇸 | Chicago 🇺🇸 | Toronto 🇨🇦
South America
São Paulo 🇧🇷
Asia
Mumbai 🇮🇳 | Tokyo 🇯🇵 | Singapore 🇸🇬
Africa
Johannesburg 🇿🇦
Oceania
Sydney 🇦🇺
Need a specific region? Feel free to contact us or join our Discord — we're always looking to expand our coverage!
Do you offer annual billing?
Yes. All paid plans are available with monthly or annual billing. Choose annual billing to get 2 months free — that's Starter at $300/year ($25/mo) and Pro at $1,000/year (~$83/mo).
You can switch between billing cycles at any time. Check the pricing page for a full comparison.
Can I self-host openstatus?
Yes. Openstatus is fully open source and can be self-hosted using its 8.5MB Docker image. You can also deploy private monitoring locations behind your firewall to check internal services not exposed to the internet.
The source code is available on GitHub.
Does openstatus have an API?
Yes. Openstatus exposes a typed JSON-over-HTTP API powered by ConnectRPC, with a published OpenAPI spec.
Every action in the dashboard — managing monitors, status pages, status reports, maintenance windows, and notification channels — is reachable from the API. The same API key works across the API, CLI, Node SDK, Terraform provider, and MCP server, and every mutation lands in the audit log.
Can I manage openstatus from Claude or ChatGPT?
Yes. Openstatus ships a remote MCP server at api.openstatus.dev/mcp that connects Claude Desktop, ChatGPT, Cursor, and any Model Context Protocol client to your workspace.
The assistant can list status pages, create and resolve status reports, and schedule maintenance windows. Every mutation tool requires the assistant to explicitly choose whether to notify subscribers — models can't quietly fan out an alert — and every call is recorded in the audit log under actor_type = 'mcp'.
Can I manage monitors as code?
Yes. Openstatus offers two ways to treat monitoring as code:
- YAML + CLI — keep your monitor configuration in your repo and sync with
openstatus monitors apply. Lighter to adopt, ships with a GitHub Action for CI/CD. - Terraform provider — for teams already managing infrastructure in HCL. Same plan-and-apply lifecycle as the rest of your stack.
Already have monitors in the dashboard? Run openstatus terraform generate from the CLI to bootstrap an HCL file with cross-references and import blocks — no hand-writing required.