Monitor values visibility
You can now hide your request values.
We have added a checkbox within your Status Page settings to hide/show the number of total and failed requests incl. the average percentage for each monitor connected to the page.
All the latest features, fixes and work to OpenStatus.
You can now hide your request values.
We have added a checkbox within your Status Page settings to hide/show the number of total and failed requests incl. the average percentage for each monitor connected to the page.
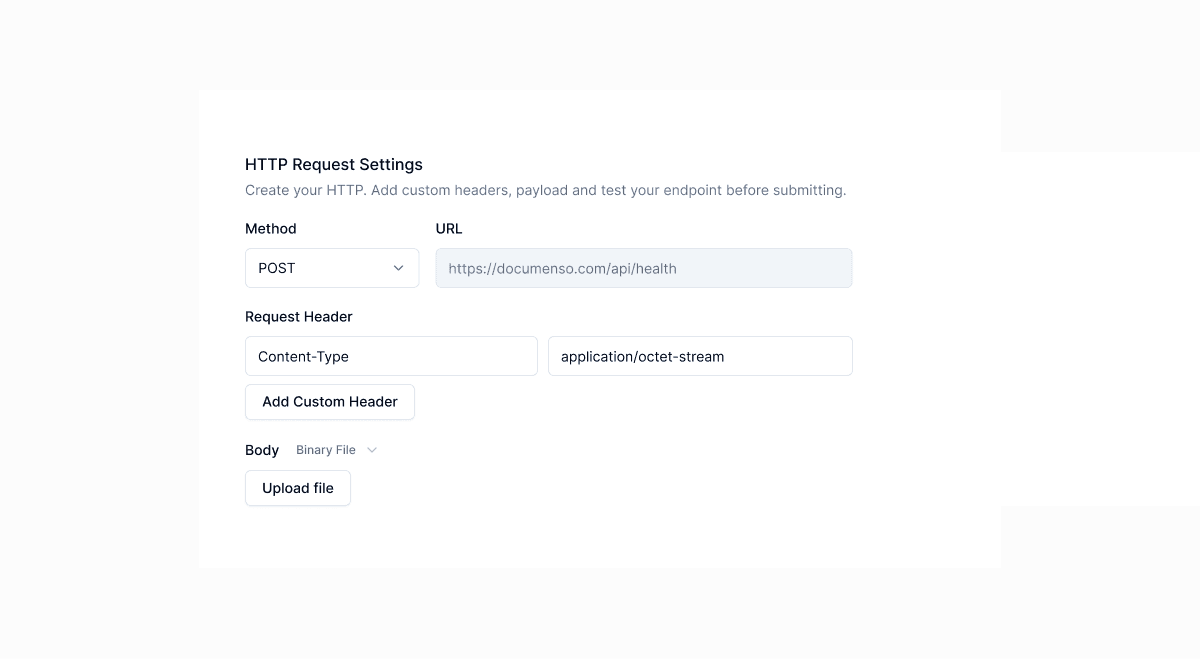
You can now include binary payloads in your HTTP synthetic check requests, which is handy for sending files or other binary data in the request body.
Additionally, you have the flexibility to set the Content-Type to your preference, such as application/octet-stream
or application/edn
.
We've refreshed the Playground for a better experience. Now, access real-time data without leaving the page.
Check out the Speed Checker.
You can deploy our checker within your infrastructure, any cloud providers or coolify by pulling the image from the container registry.
The image is available at ghcr.io/openstatushq/checker:latest
.
It opens up a lot of possibilities to run the checker in your own environment, on your own infrastructure, or on any cloud provider. We will be able to add private locations soon.
We have wrote a guide to help you deploy our checker on Koyeb.
Thanks to Depot for the fast build and the easy integration with GitHub Actions.
We have reworked our status page!
Sometimes you need to create a copy of your monitor with the same settings quickly and easily.
You can now clone a monitor directly from the action menu in the monitor table.
We have added this feature to the monitor settings.
Shout-out to @Ipriyankrajai for his contribution!
The location of your reports has changed. The can be found within the connected status page. No need to connect manually to a status page.
If you encounter any issues. Please contact us.
Sometimes you need to get notified if your monitor is taking too long to respond or if it's degrading.
You can set custom request timeouts and degradation timing for your monitors.
We have added this feature to the monitor settings.
We've added a PagerDuty integration to the notification feature. This allows you to receive incident alerts through PagerDuty.
We have added more regions to OpenStatus.
You can now monitor your endpoint from 35 regions.
Here is the list of the all our supported regions:
Africa
Asia
Europe
North America
South America
Oceania
Let's make synthetic monitoring more global! 🌐