Changelog

All the latest features, fixes and work to OpenStatus.

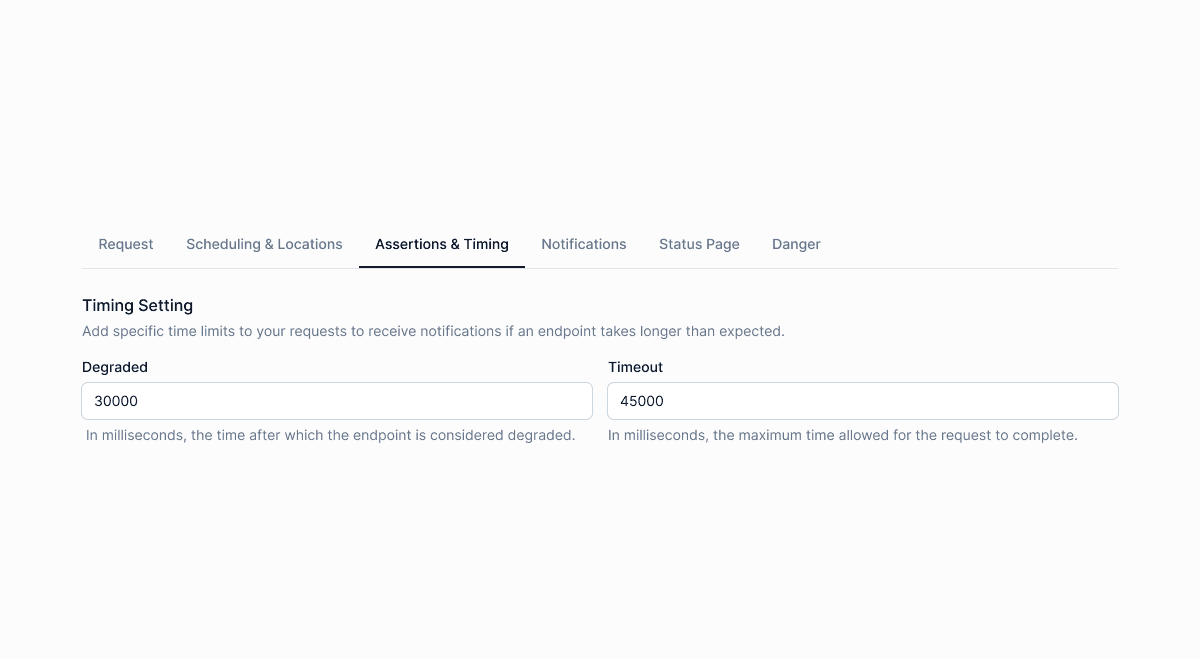
Monitor Threshold

Monitor Threshold

Sometimes you need to get notified if your monitor is taking too long to respond or if it's degrading.

You can set custom request timeouts and degradation timing for your monitors.

We have added this feature to the monitor settings.

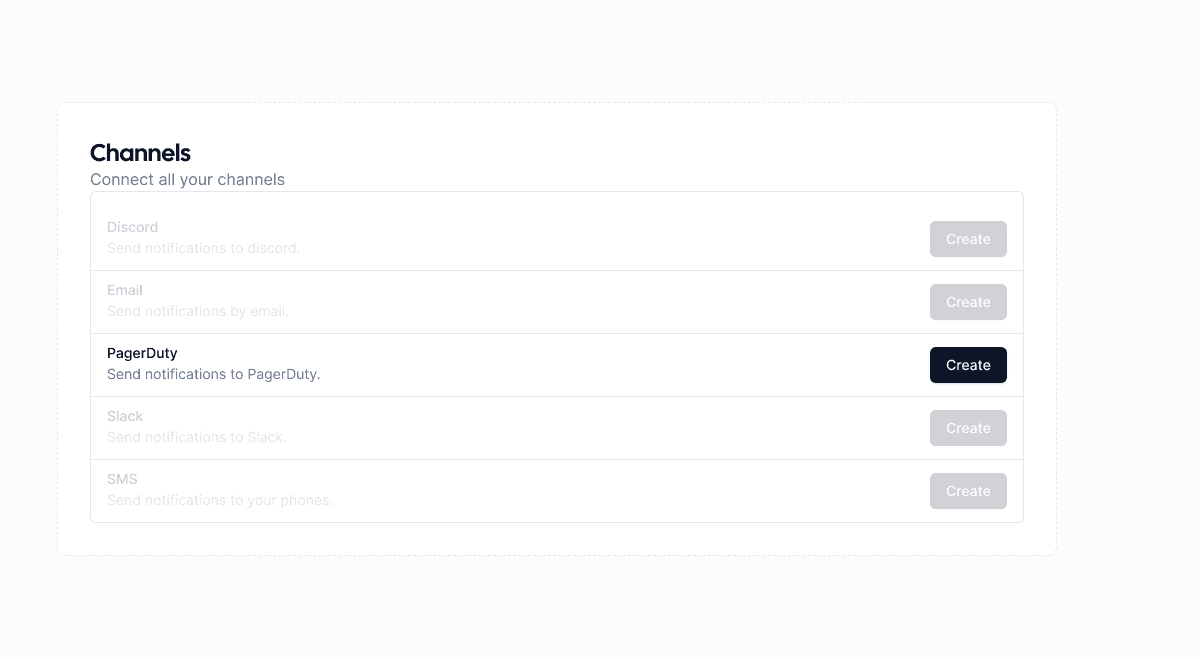
PagerDuty Integration

PagerDuty Integration

We've added a PagerDuty integration to the notification feature. This allows you to receive incident alerts through PagerDuty.

More regions available 🌐

More regions available 🌐

We have added more regions to OpenStatus.

You can now monitor your endpoint from 35 regions.

Here is the list of the all our supported regions:

Africa

  • Johannesburg, South Africa 🇿🇦

Asia

  • Hong Kong, Hong Kong 🇭🇰
  • Mumbai, India 🇮🇳
  • Singapore, Singapore 🇸🇬
  • Tokyo, Japan 🇯🇵

Europe

  • Amsterdam, Netherlands 🇳🇱
  • Bucharest, Romania 🇷🇴
  • Frankfurt, Germany 🇩🇪
  • London, United Kingdom 🇬🇧
  • Madrid, Spain 🇪🇸
  • Paris, France 🇫🇷
  • Stockholm, Sweden 🇸🇪
  • Warsaw, Poland 🇵🇱

North America

  • Ashburn, Virginia, USA 🇺🇸
  • Atlanta, Georgia, USA 🇺🇸
  • Boston, Massachusetts, USA 🇺🇸
  • Chicago, Illinois, USA 🇺🇸
  • Dallas, Texas, USA 🇺🇸
  • Denver, Colorado, USA 🇺🇸
  • Guadalajara, Mexico 🇲🇽
  • Los Angeles, California, USA 🇺🇸
  • Miami, Florida, USA 🇺🇸
  • Montreal, Canada 🇨🇦
  • Phoenix, Arizona, USA 🇺🇸
  • Queretaro, Mexico 🇲🇽
  • Seattle, Washington, USA 🇺🇸
  • San Jose, California, USA 🇺🇸
  • Toronto, Canada 🇨🇦

South America

  • Bogota, Colombia 🇨🇴
  • Buenos Aires, Argentina 🇦🇷
  • Rio de Janeiro, Brazil 🇧🇷
  • Sao Paulo, Brazil 🇧🇷
  • Santiago, Chile 🇨🇱

Oceania

  • Sydney, Australia 🇦🇺

Let's make synthetic monitoring more global! 🌐

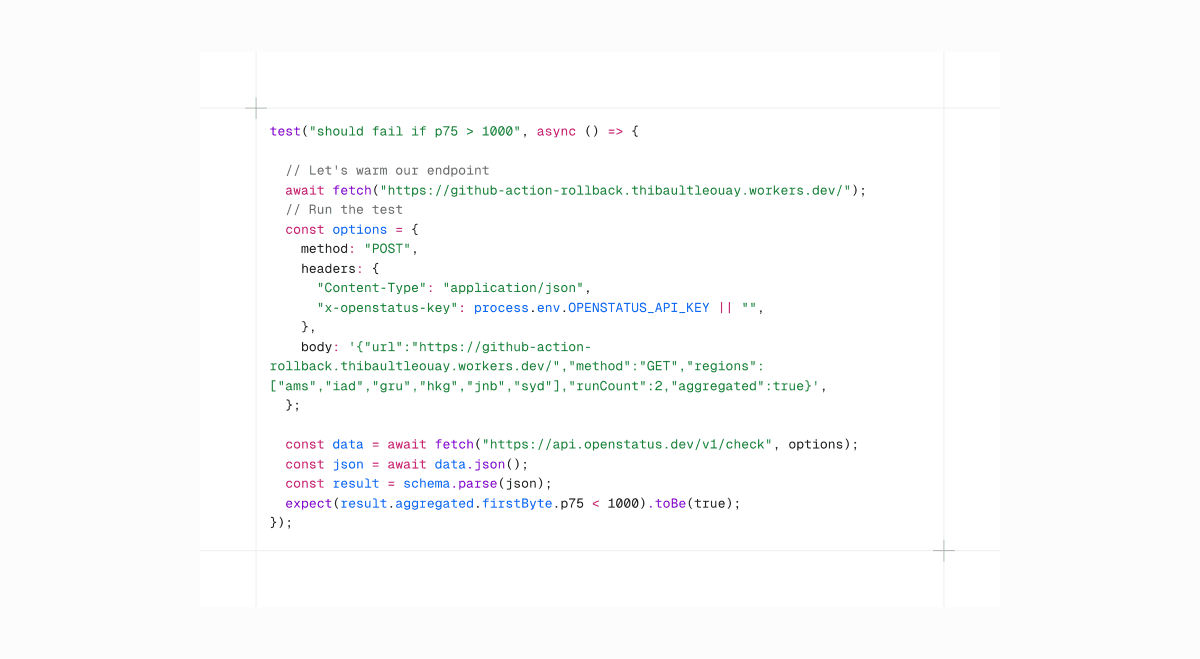
Run Check API

Run Check API

We have added a new API to launch a check with OpenStatus. You can now test your endpoint's latency programmatically.

It's useful if you want to integrate OpenStatus with your CI/CD pipeline.

You can read the API documentation.

Maintenance status

Maintenance status

You can now set your status to Under Maintenance to inform your users that you're performing maintenance. You'll be able to set the start and end times for the maintenance period. During this time, we will pause the connected monitors and suppress any notifications.

To create a maintenance, go to the corresponding status page and click the 'Maintenance' sub navigation. From there, you can create a new maintenance status, including title and description.

The users will be able to see all maintenances under a new tab on the status page.
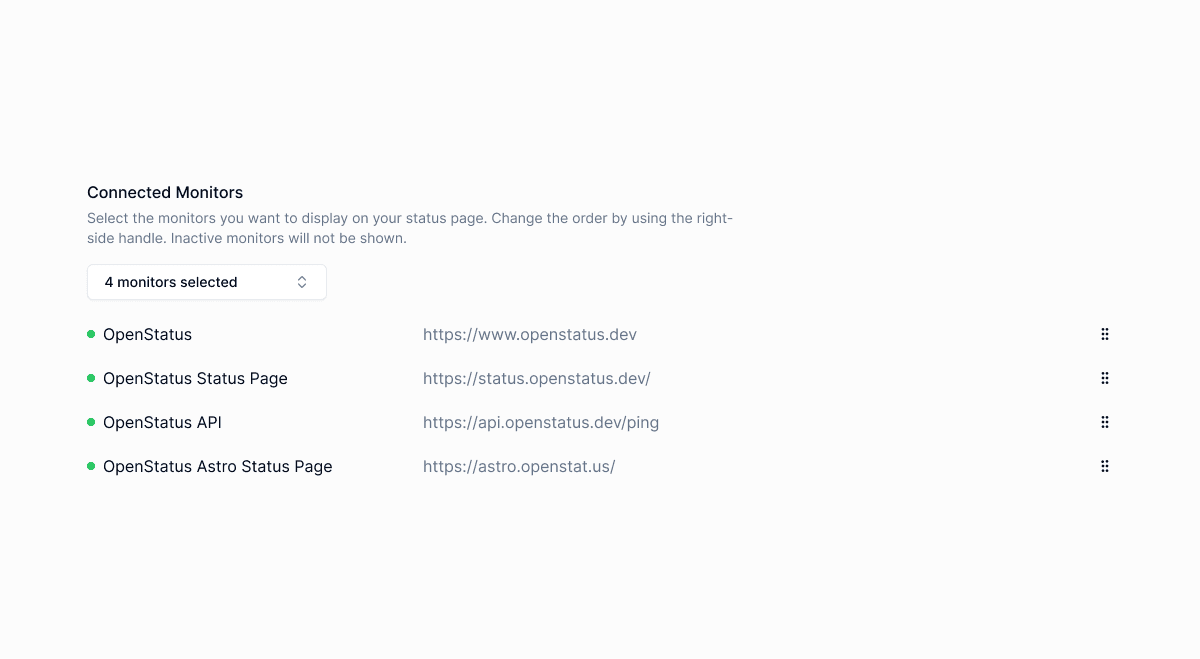
Status page monitor order

Status page monitor order

You can now sort your monitors by importance on your status page. This allows you to prioritize the most important monitors and show them at the top of your status page.

Powered by sortable.sadmn.com.

Password-protected status page

Password-protected status page

You can now protect your status page with a password. This will hide the page from the public and only allow access to users with the password.

You can enable the password protection from the status page within the Visibility settings. You will be able to:

  • Enable the feature with a simple checkbox to easily turn it on and off
  • Set your password
  • Share the protected page with a ?authorize=your-password query parameter to auto-complete the password field

This feature is available on the Starter plan and above.

Status Page SVG Badge

Status Page SVG Badge

We have added a new feature to embed the status of your service everywhere.

Just copy the following code and paste it into your website or GitHub README:

And it will look like this:

Public Monitors

Public Monitors

You can now change the monitors visibility to public. This will allow you to share the monitor's metrics (the overview page) with your users. The period is restricted to 1d and 7d for now.

The monitor can be accessed either by the public URL or/and by embedding the monitor within a status page.

You can enable public mode from the monitor Danger section setting.

Website screenshots for incidents

Website screenshots for incidents

We want to provide you with as much context as possible when an incident occurs. That's why we've added website screenshots to incidents.

When creating an incident, we capture a website screenshot for added context. We also take a screenshot upon resolving the incident to see the website post-resolution.